RBC Capital Markets
The short version
RBC Capital Markets ran an internal sales platform called Salesbook. Its Opportunities screen was the one place salespeople went to decide which clients to call, about which bonds, with what context. Over time it had grown into an eight-panel wall of data — Axes, Bond Matches, Client Matches, Trade History, New Issues, Portfolio Match, Feedback, Live Prices — that took hours of training to read and slowed the workflow it was meant to support.
I led UX research and design on the redesign: turning an unfamiliar capital-markets workflow into a testable model, validating it with salespeople on the trading floor, and shipping a high-fidelity prototype and visual direction for the product.
The engagement closed in April 2016 with the v1.6 visual delivery — the spec handed to Iris Software for the production Salesbook build. The screen that took hours of training became one a salesperson could enter from any starting point — a calling client, a trader's tip, a search — and read at a glance.
4 mo
Engagement length from discovery to final prototype
8 → 1
Panels collapsed into a single adaptive workflow
5 min
Rapid testing sessions on the trading floor
3
Prototype directions tested, each isolating one design variable
The brief
The engagement started with a short deck from RBC's Sales Technology group. They didn't open with a UI ask. They opened with a workflow problem — and named it in their own words.
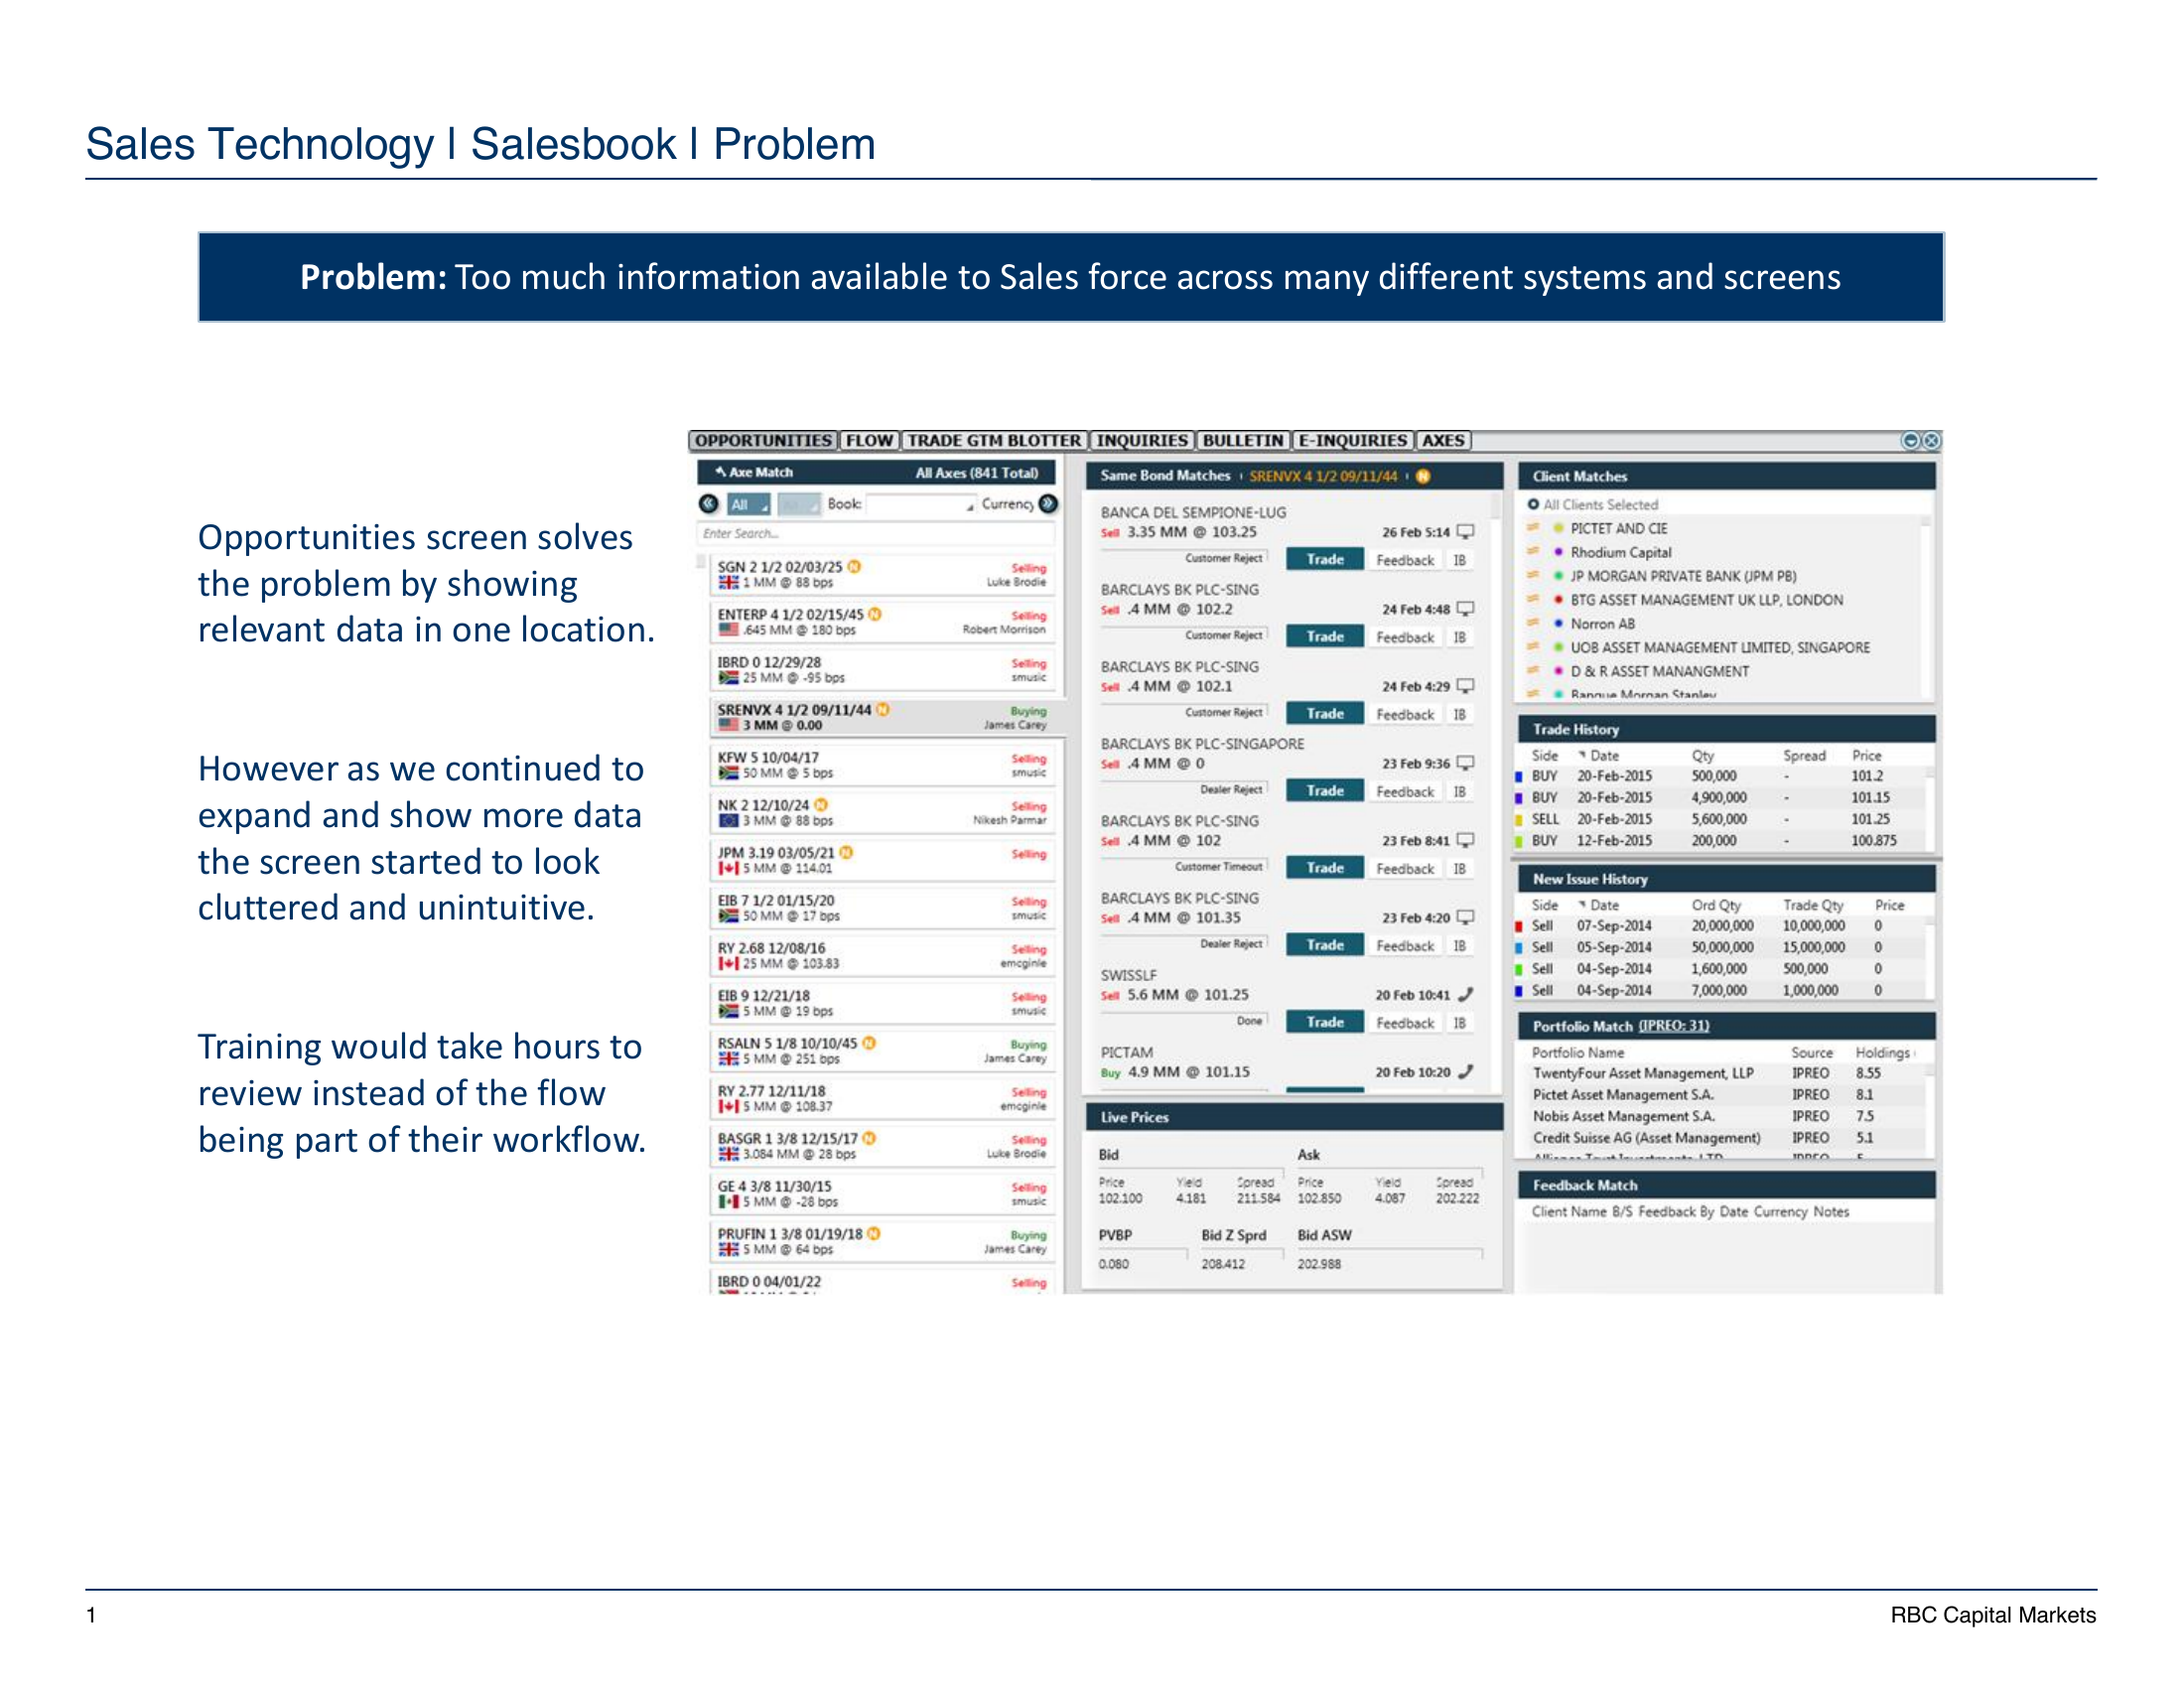
"Too much information available to Sales force across many different systems and screens. The Opportunities screen solves the problem by showing relevant data in one location. However as we continued to expand and show more data the screen started to look cluttered and unintuitive. Training would take hours to review instead of the flow being part of their workflow."
RBC Capital Markets · Salesbook Enhancement brief, Aug 2015
This is what salespeople were actually looking at — eight stacked panels of dense financial data, side-by-side on a single desktop screen, packed with axes, bond matches, client matches, trade history, new issues, portfolio matches, feedback, and live prices. The shape of the problem was clear: not a missing feature, but a missing model of work.
Reframing the workflow
The instinct in a project like this is to start with the screen: simplify the panels, rework the hierarchy, redesign the components. I held that off. The same brief had a second slide that gave away the deeper problem — and it wasn't the UI.
RBC mapped the existing flow as three rigid steps: a list of axes appears, salespeople pick one, and everything else updates around the selection. That worked when an axe was always the starting point. But salespeople actually entered the screen from anywhere — a client calling in, a trader walking over with a security in mind, a portfolio note from yesterday. The screen had everything they needed; it only had one way to ask for it.
So before any layout work, I pushed on the workflow itself. Free search as the front door, with security-first and client-first as named entry paths. The screen would adapt to the way the question was being asked, not the other way around.
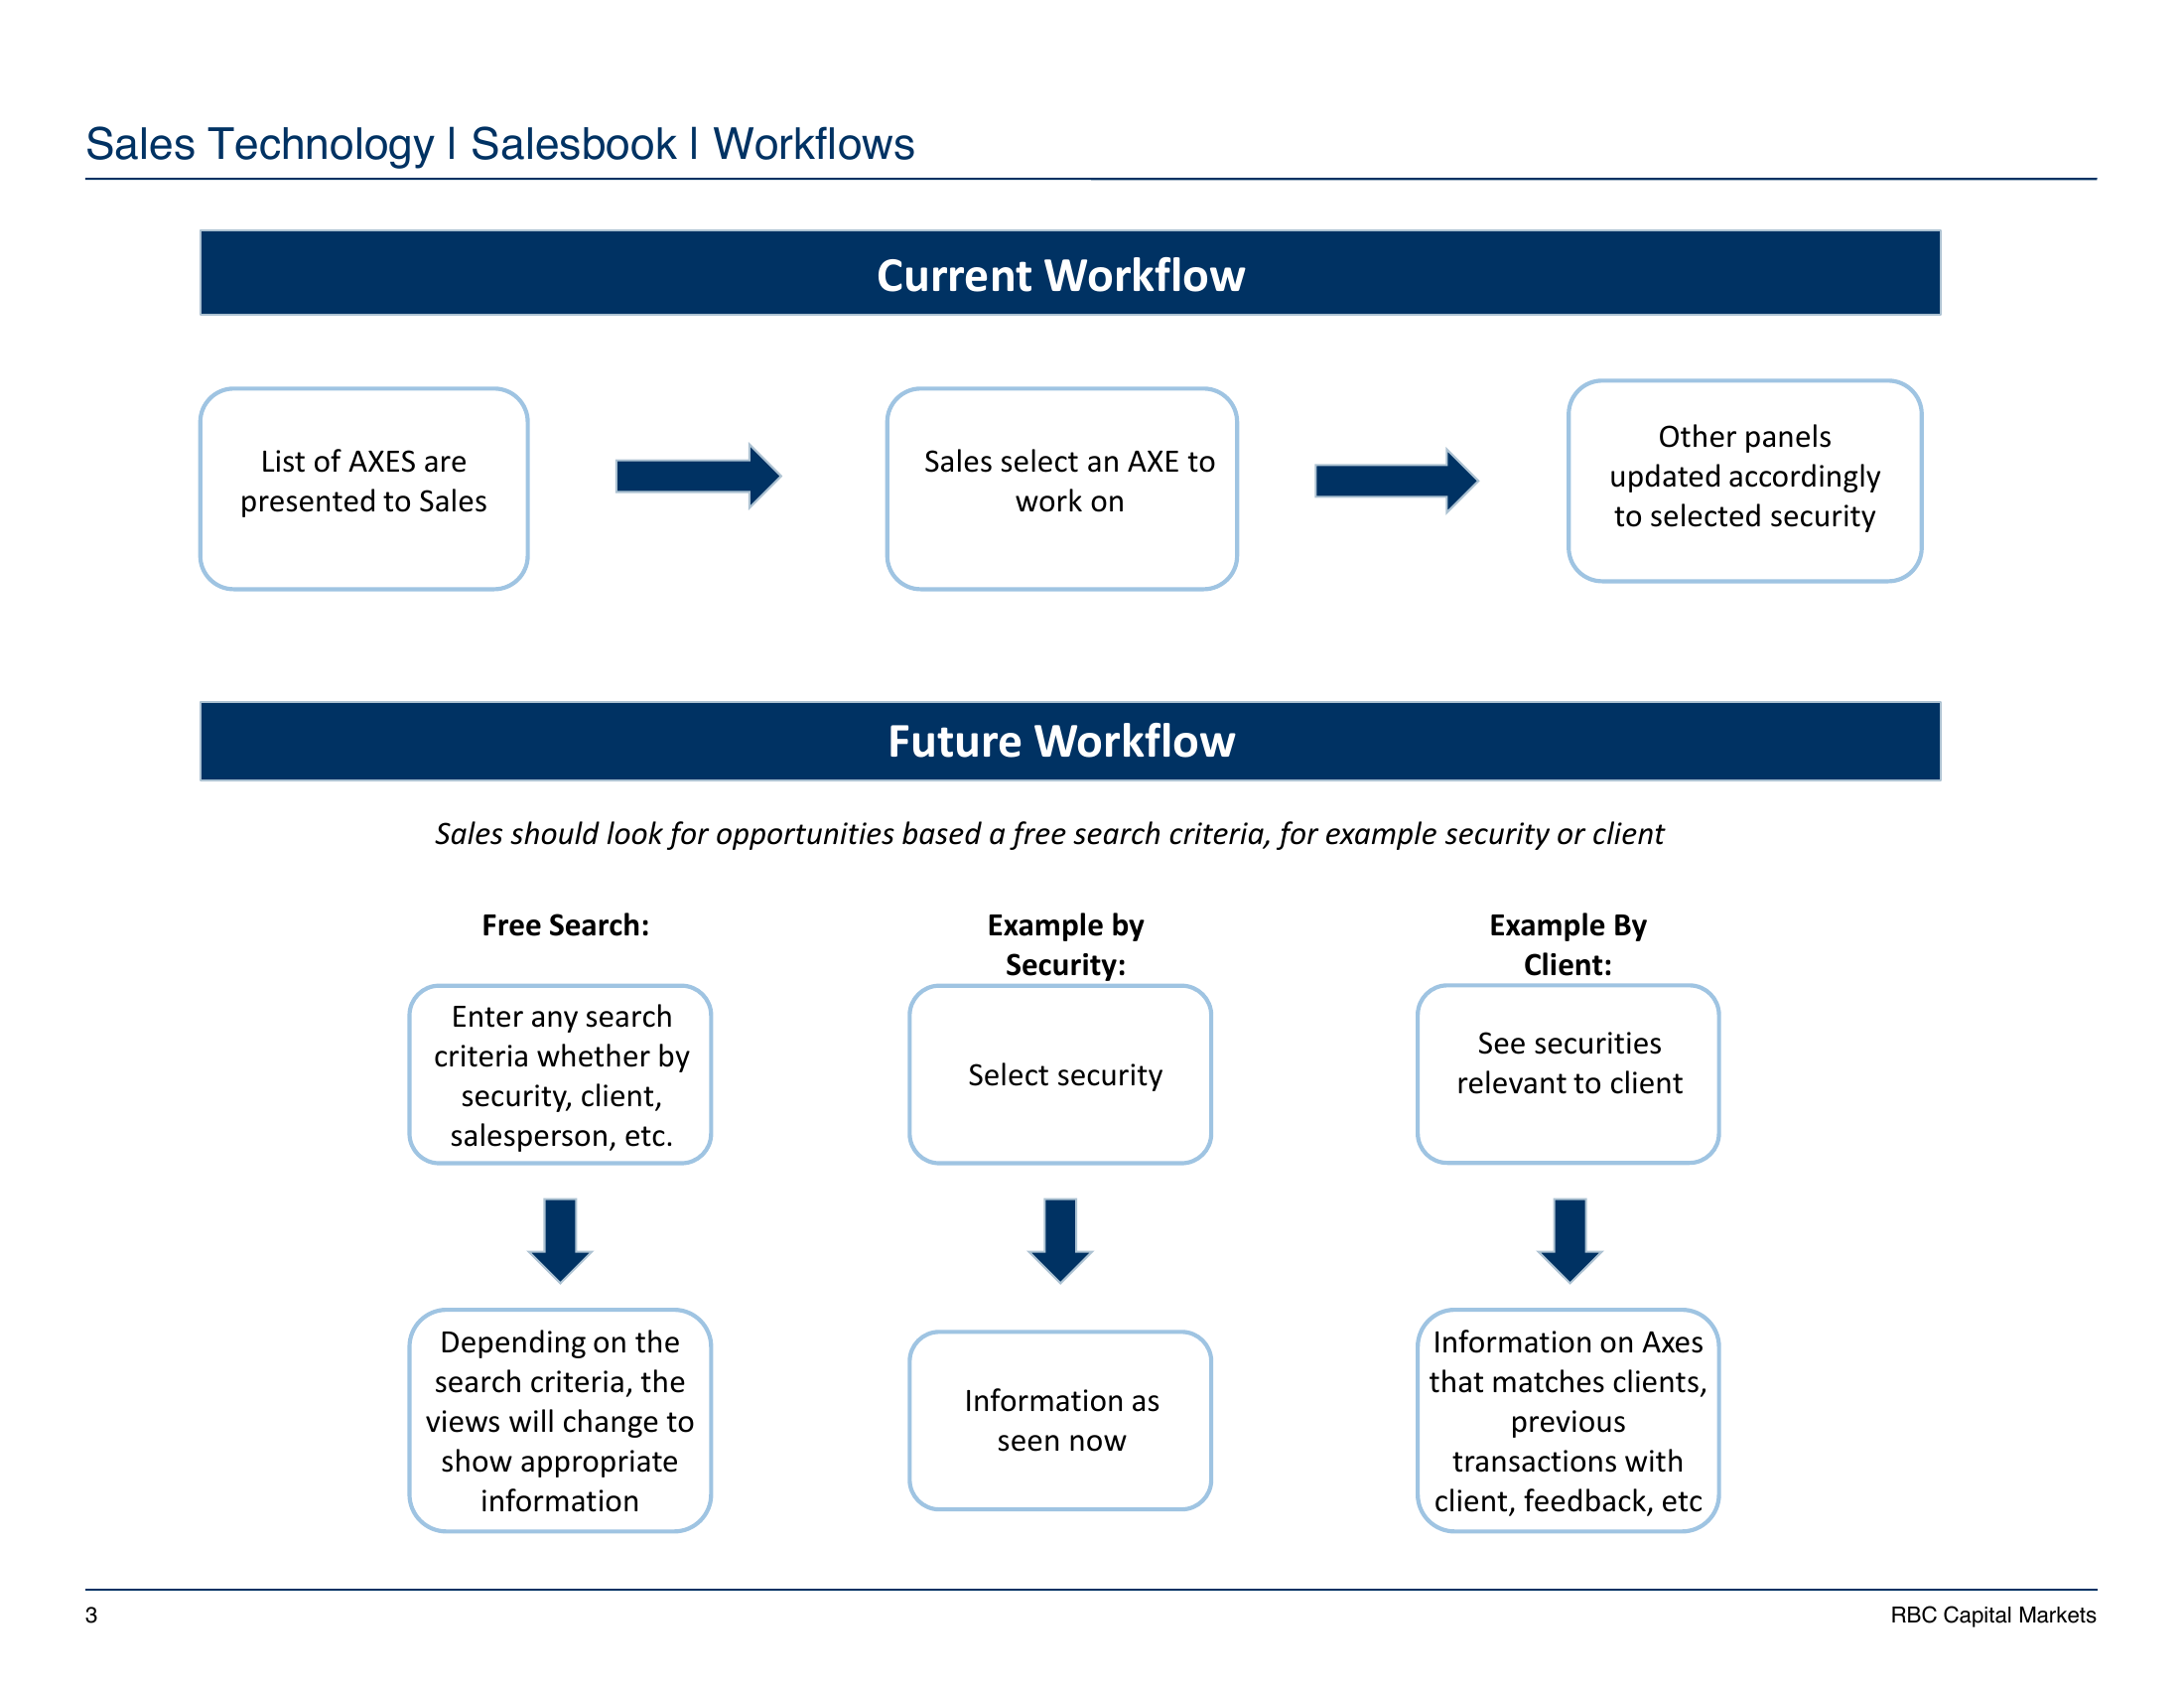
This is the move the rest of the case study rests on. The visible problem — a cluttered screen — was downstream of a model problem: a single fixed path through a workflow with many real starting points. Naming three workflows up front let everything that followed (research, prototype, testing) ladder back to a shared structure instead of feature-by-feature opinion.
The team I worked across
The work moved across three organizations. Each had its own incentives, its own vocabulary, and its own definition of "good." Most of the design judgment in this case study lived in the seams between them.
Client
RBC Capital Markets
Sales Technology group set the brief. Five reviewers across product, sales floor, and visual design fed into the synthesis. Three salespeople on the trading floor were the recurring test partners.
Engineering partner
Iris Software
Built the production Salesbook codebase. Joined design reviews to anchor what was implementable inside the broader product, especially around real-time data and density.
UX vendor
DesignForUse
A small consultancy retained by RBC for the engagement. Two designers, including me as the embedded lead through discovery, research, prototype, and final visual direction.
Understanding the domain
The hardest part of the project was not screen layout. It was understanding what mattered in the sales workflow. Salespeople were not watching live markets the way traders were. They were looking for fit: which client, which security, what timing, what history, and what conversation would create a useful opportunity.
- Salespeople bridge the bank's clients and traders, translating trader priorities into client conversations.
- The day starts early with traders identifying securities to focus on; salespeople then prioritize calls and outreach.
- Salespeople pull context from multiple systems: CRM, Bloomberg Terminal, internal spreadsheets, trade history, and portfolio data.
- Unlike traders, salespeople care less about live price movement and more about patterns in client behavior and market fit.
- The experience had to be desktop-first. Mobile and tablet were not part of the real workflow.
Field research
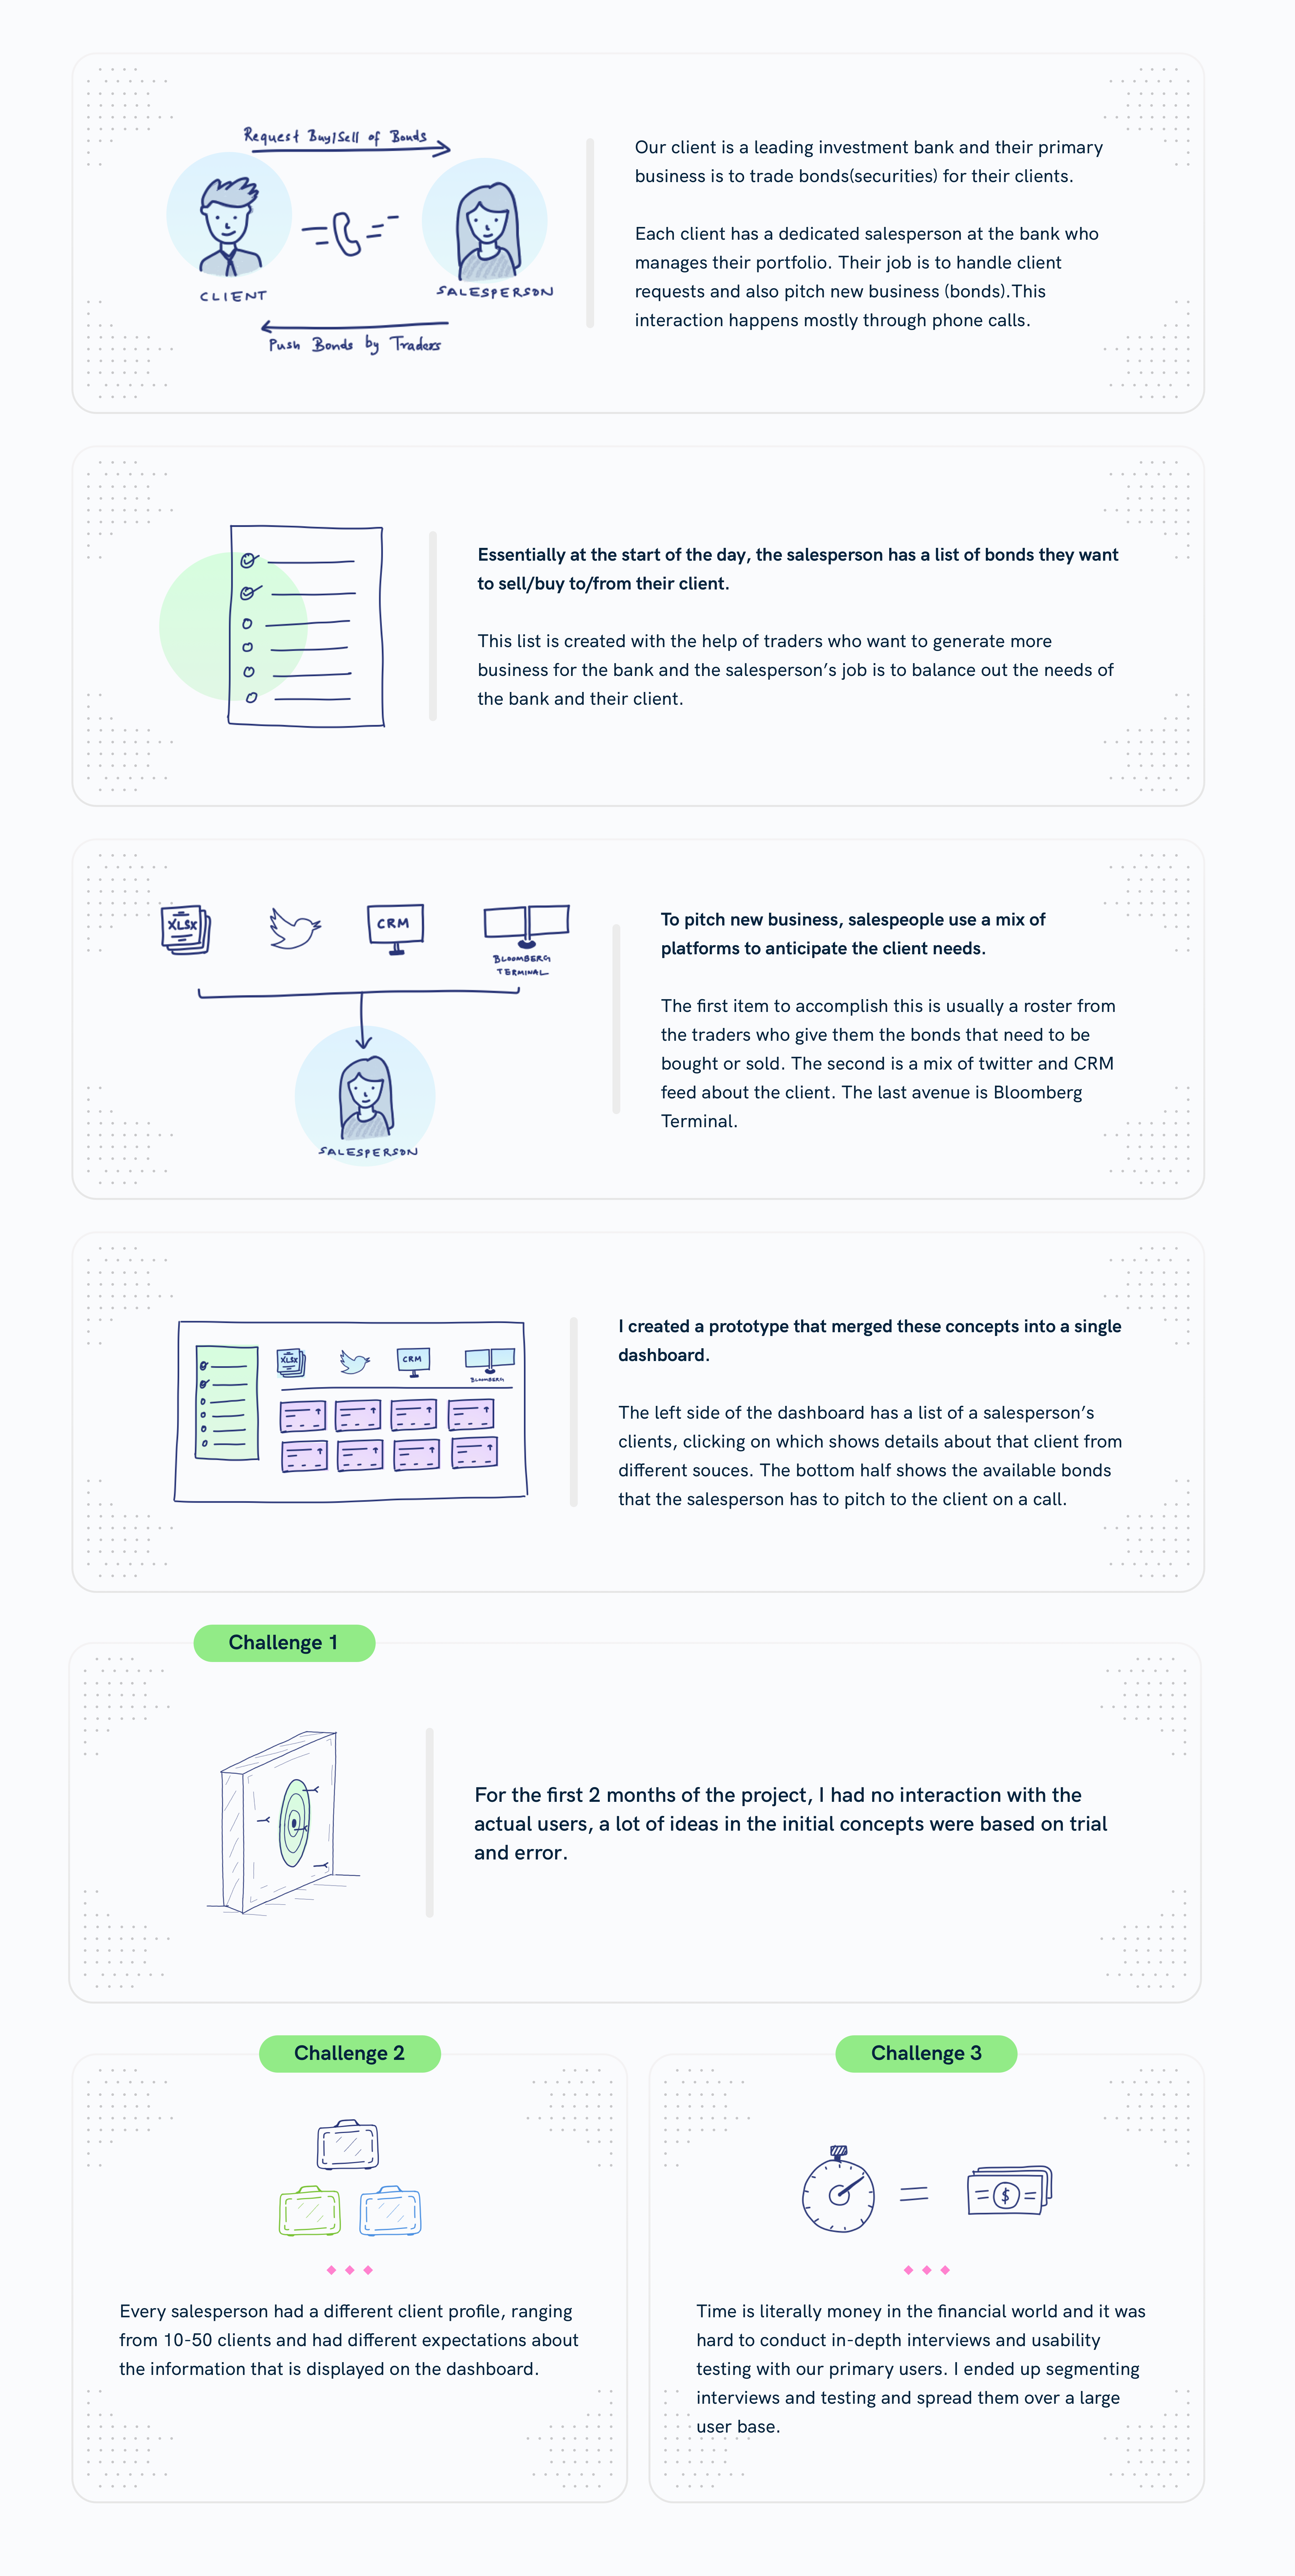
Early concepts were built with limited access to end users, so the team had to make assumptions and validate them quickly. Once we met users, I shifted the work from a generic dashboard concept toward task analysis: how salespeople start their day, move between client and security context, and capture feedback after a call.
The trading floor context shaped the product constraints. People sat close enough for verbal communication to matter. They worked from the office, not on mobile. Their layouts needed to be customizable because every desk and coverage area had different tab structures and habits.
The plan for each floor visit was deliberately small: about 15 minutes of structured Q&A per salesperson, then 15–20 minutes of silent observation. We optimized for seeing the workflow more than hearing about it — a sales floor is a place where what people do often differs from what they say they do.
Research instrument
The questionnaire we sent before the first floor visit
Internal memo · 21 Jan 2016 · 15 min Q&A + 15–20 min observation
Research instrument
The questionnaire we sent before the first floor visit
Internal memo · 21 Jan 2016 · 15 min Q&A + 15–20 min observation
Intro: why we're here, and what we want to get out of the conversation with the sales people.
- What does a typical day look like for you? When do you get in? What do you do first, in the morning, afternoon, just before finishing up? Do you have a checklist or to-dos — mental or otherwise — before coming to the office?
- How many clients do you have? What's the approximate split between you reaching out to clients vs. them calling you? What percentage of time do you use the phone vs. IB chat?
- Could you walk us through a typical client interaction from start to closure? Is it any different if they call you? (Probe on verbal communication with traders and other salespeople through an interaction.)
- Do you use the Opportunities tab? How long have you been using it? What works and what doesn't? (If not — ask how they initiate a client call instead.)
- Ideally, what would you like to have in front of you before reaching out to a client?
- Anything else you'd like to tell us? (Catch-all, open-ended.)
Q1 sets the day's frame. Q2 and Q3 surface the structure of their work. Q4 is the only product-specific question — deliberately placed late so users frame the screen in terms of their workflow, not the other way around. Q5 forces them to imagine the tool that would actually help, in their own words.
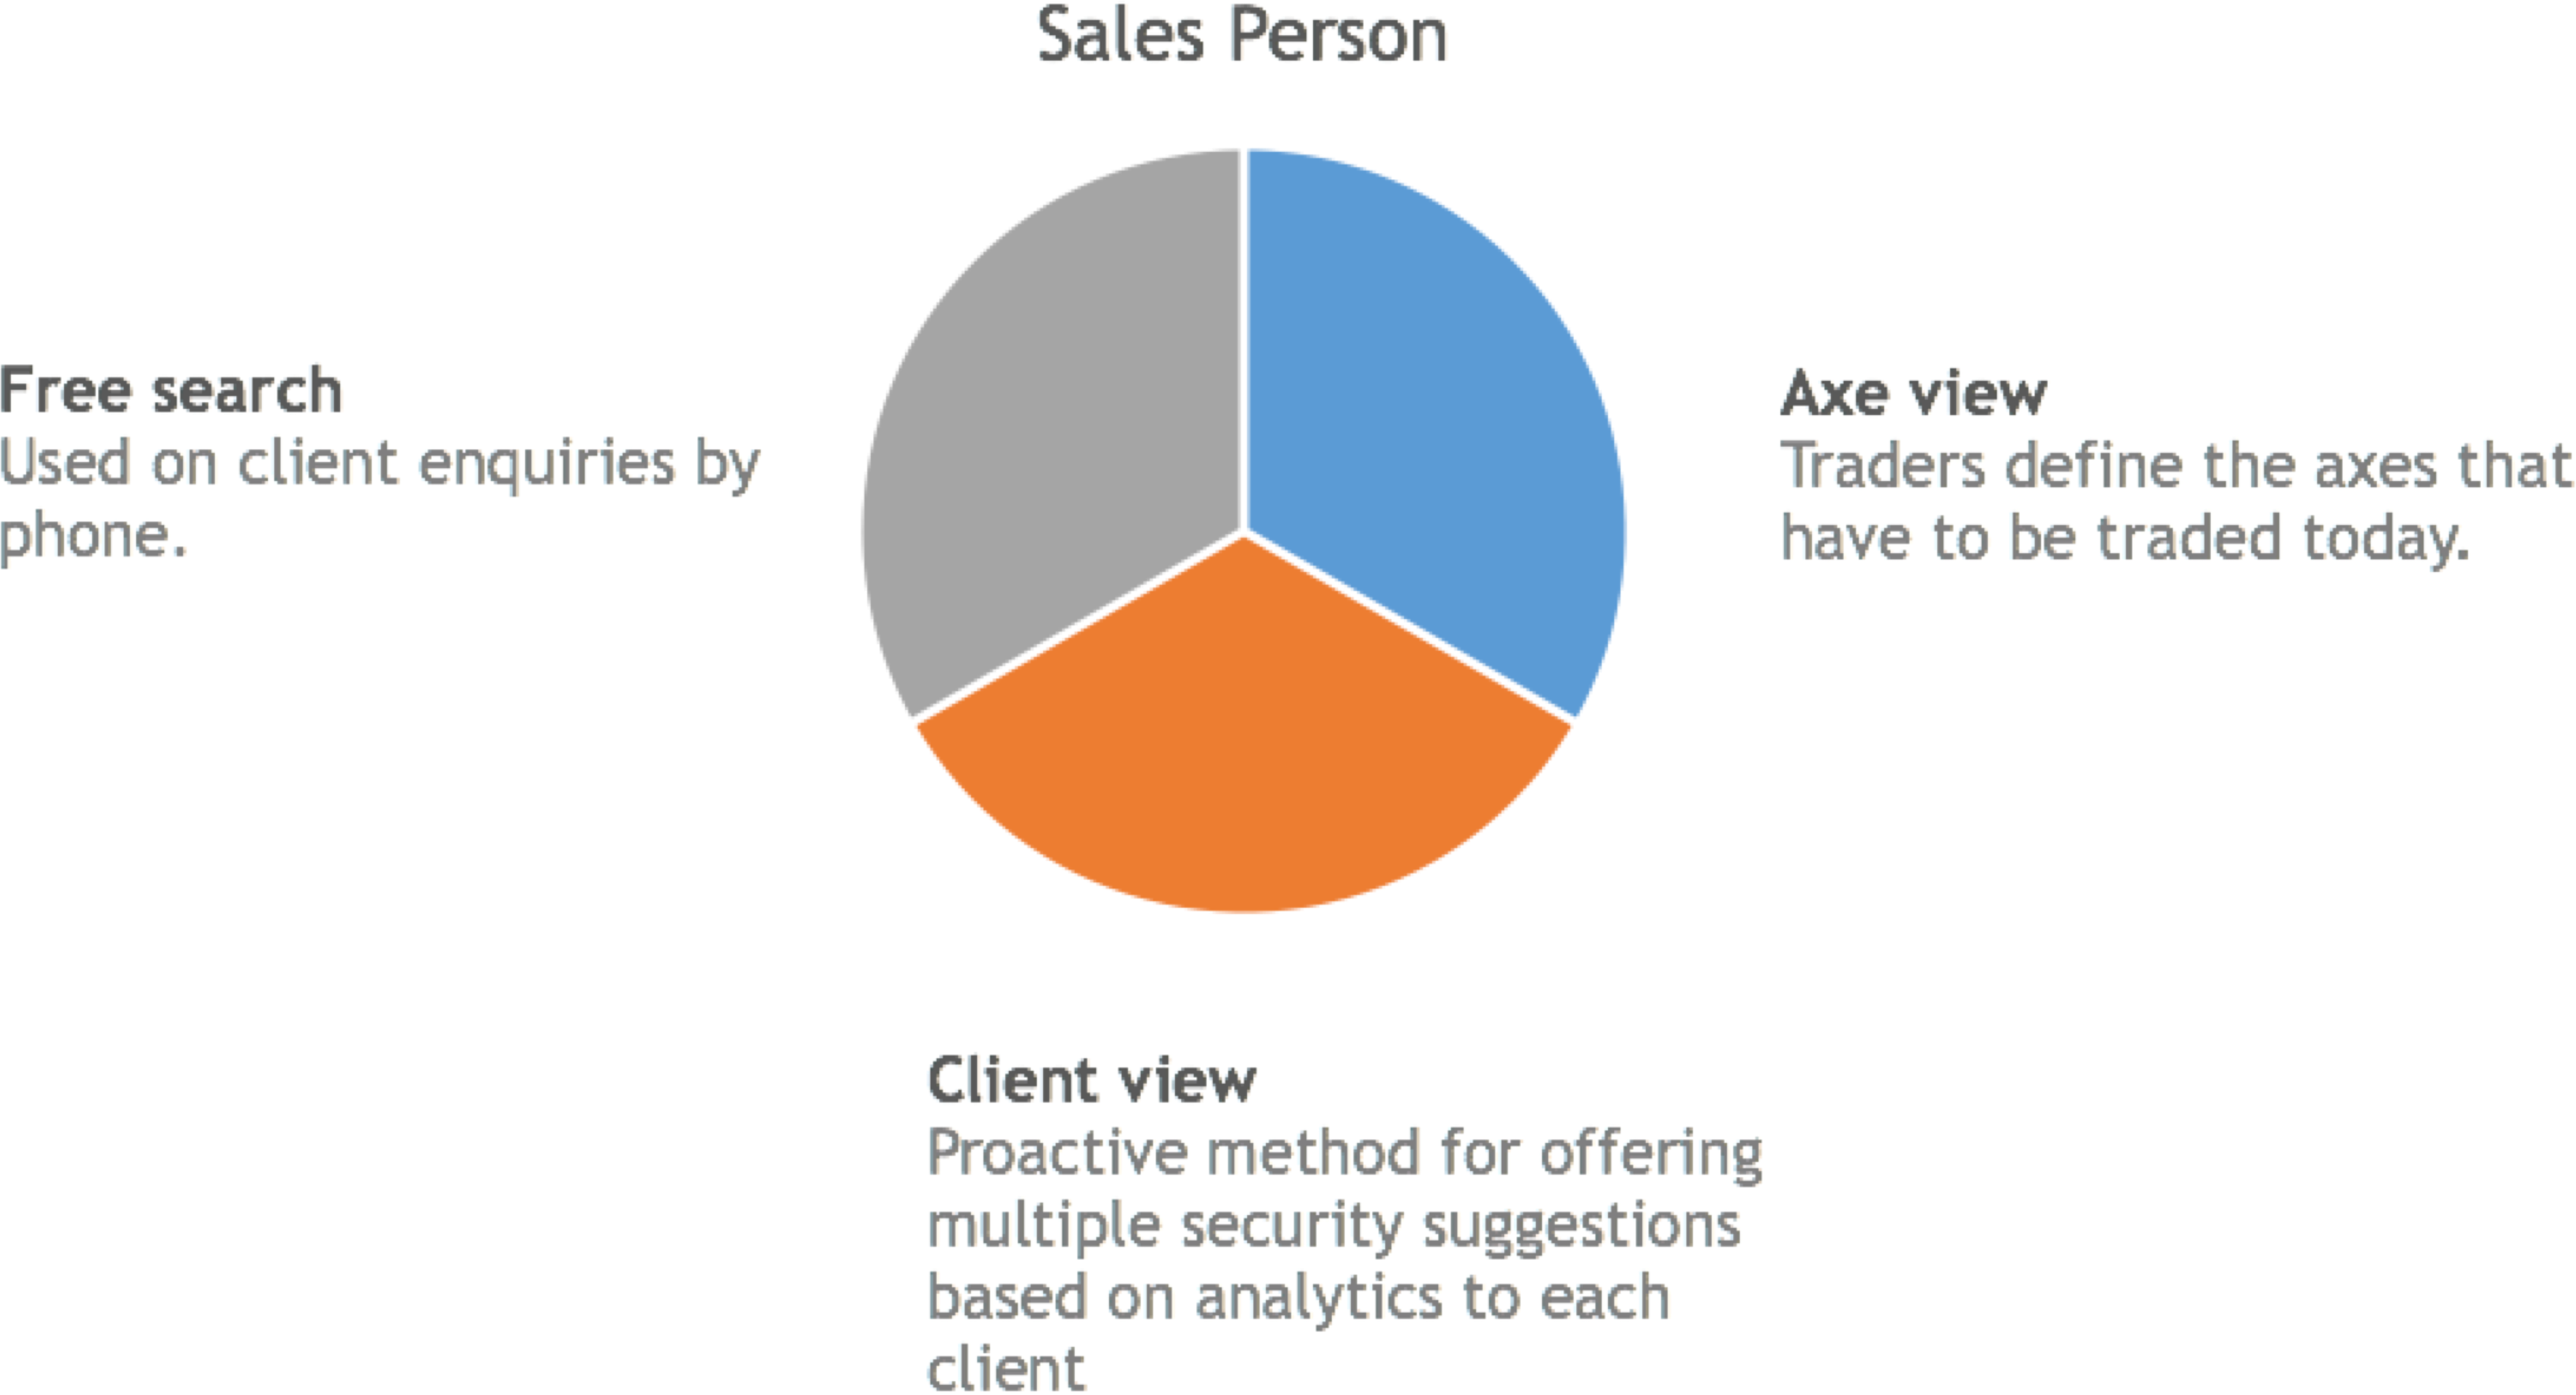
Three core workflows
Security-first workflow
A trader defines securities in focus at the start of the day. The system ranks them using client portfolio fit, holdings, recent transactions, and other internal signals. Salespeople can start with a security, inspect matching clients, then call or message the right contacts.
Client-first workflow
A salesperson may start from a focus-client list ordered by revenue, recent transactions, hit ratio, and holdings. Selecting a client reveals securities they may be interested in, along with relevant market and portfolio context.
Search-driven workflow
When a client calls directly, or a trader verbally points a salesperson toward an opportunity, free search lets the salesperson find either a client or a security and shift into the right workflow from there.
Working it out on paper
Once the three workflows were named, I spent the first week of design on paper, not in Sketch. The cost of an idea on paper is roughly zero; the cost of an idea in pixels is a day. At this stage I wanted to be wrong fast and often.
The frames below are seven of the early sketches that stuck. They aren't pretty — they're working drawings, the kind that get scanned at the end of a session and forgotten until the case study. Click any one to take a closer look.
Two ideas survived from paper into the final design intact: the dual-axis frame (clients on one side, securities on the other) and the tile as the unit of an axe. Almost everything else — the geographic exploration, the tab-led variant, the specific drill-down arrangement — got revised, replaced, or rejected. Which is exactly the point of working this loosely this early.
High-fidelity prototype
I built three directions in Axure rather than one. The reason was timing: salespeople had five-minute windows between client calls, and the only honest way to learn anything in five minutes was to put real options in front of them and watch which one they reached for. Each direction held the same workflow constant but moved one variable — tile density, visual tone, or the role of the sidebar — so user reactions could be attributed to a specific choice rather than aesthetics in general.
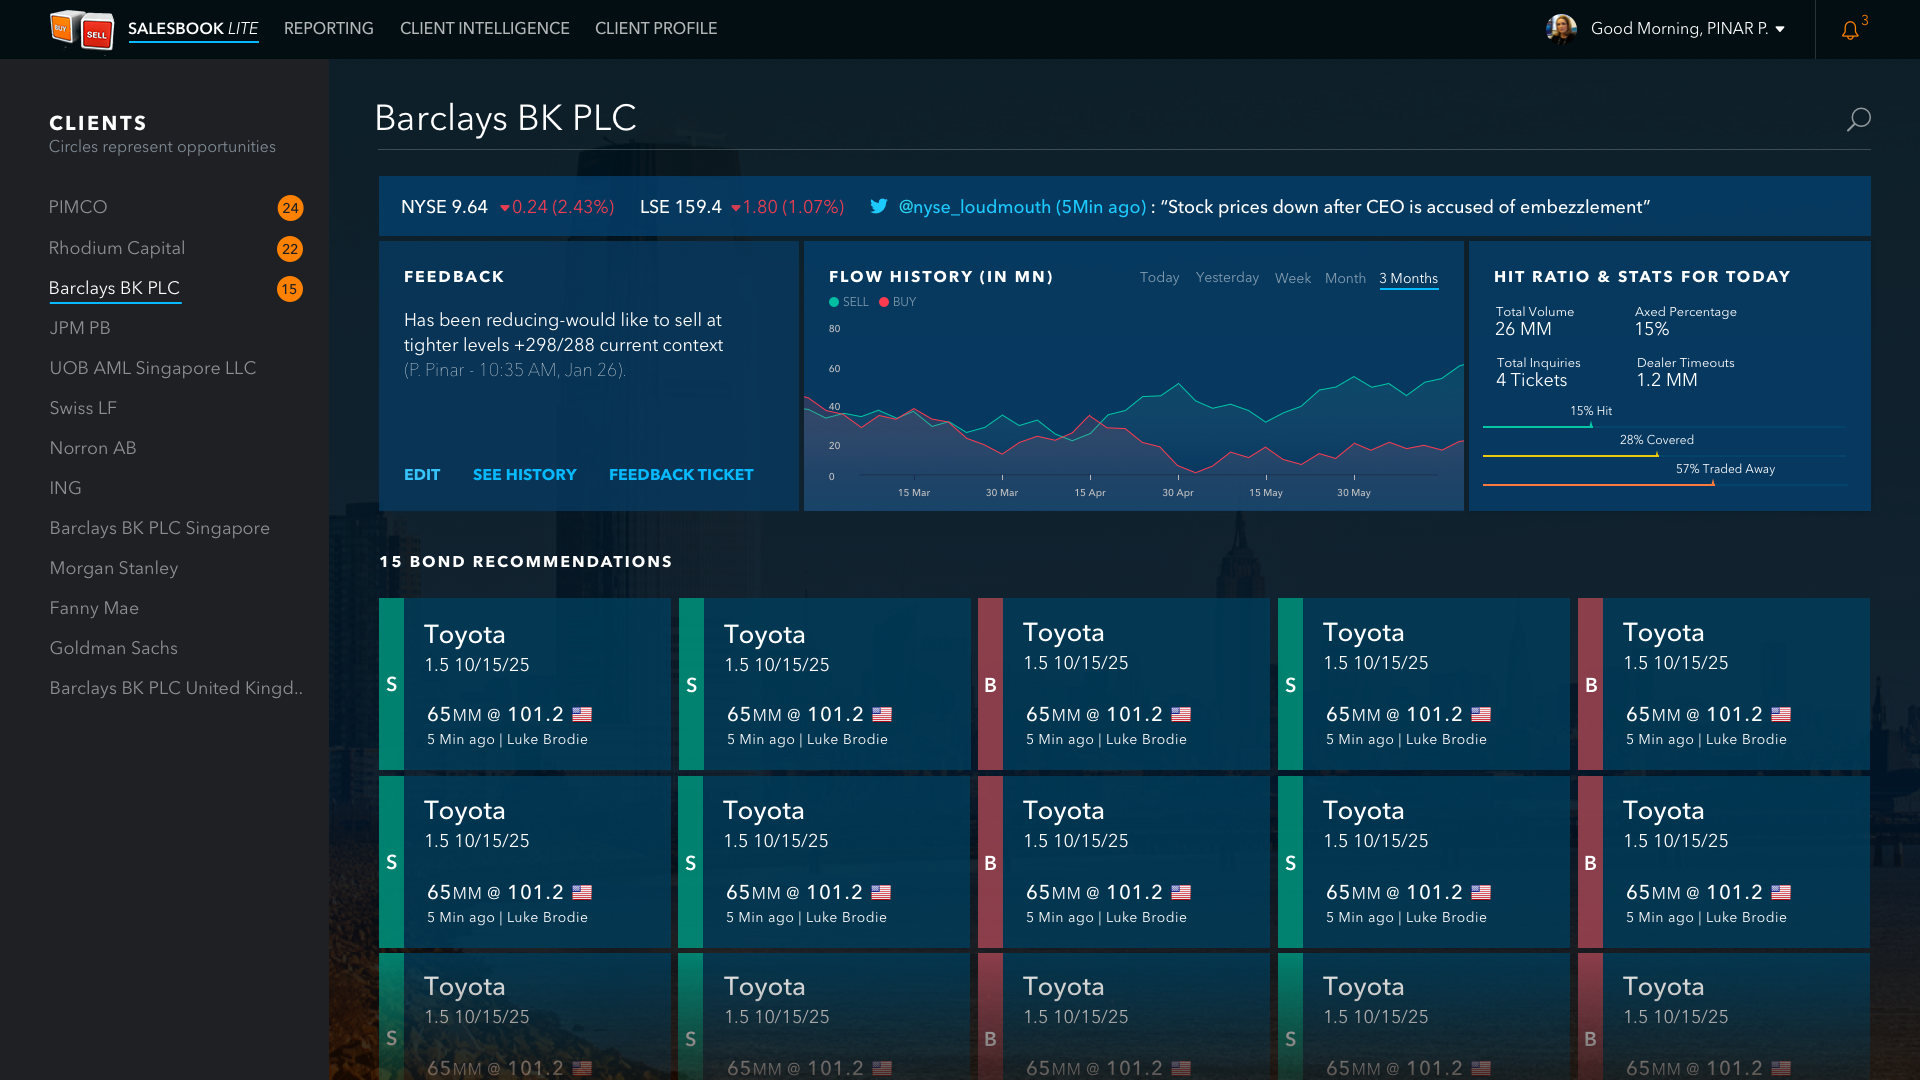
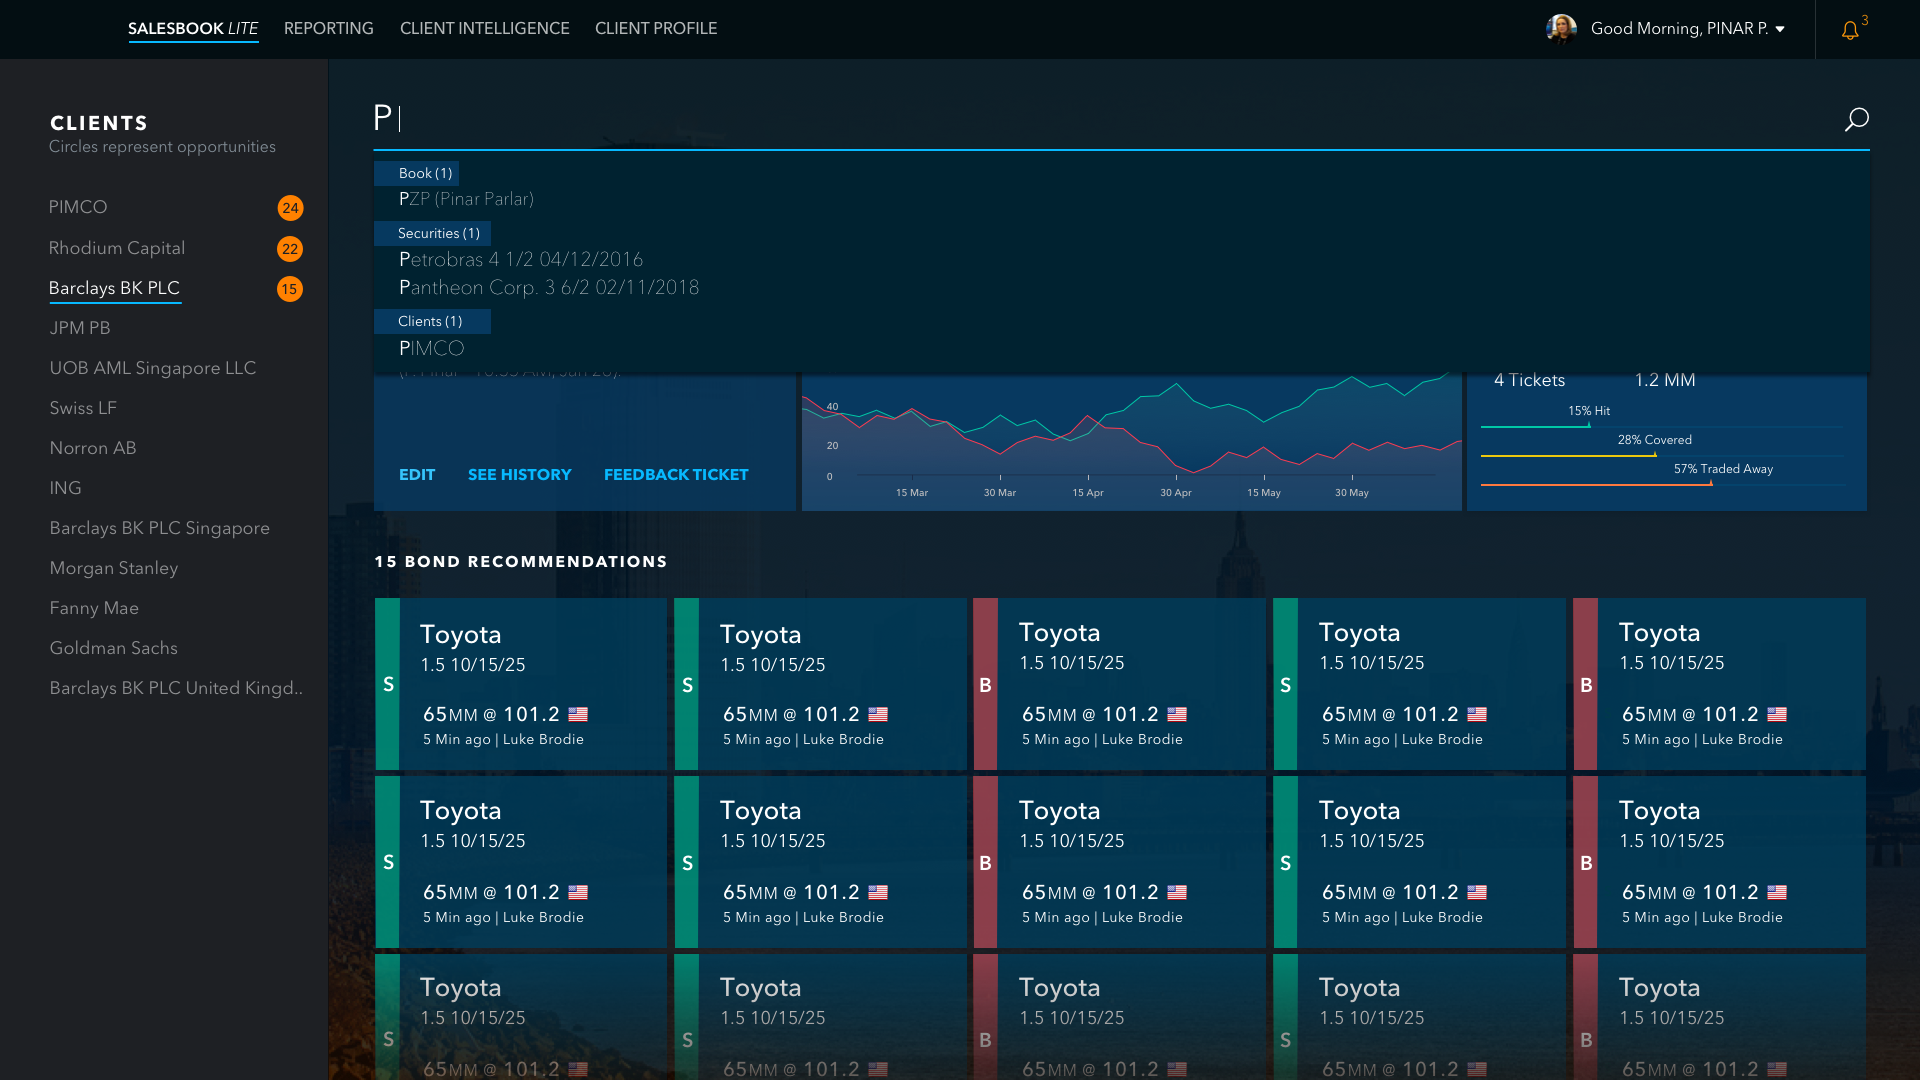
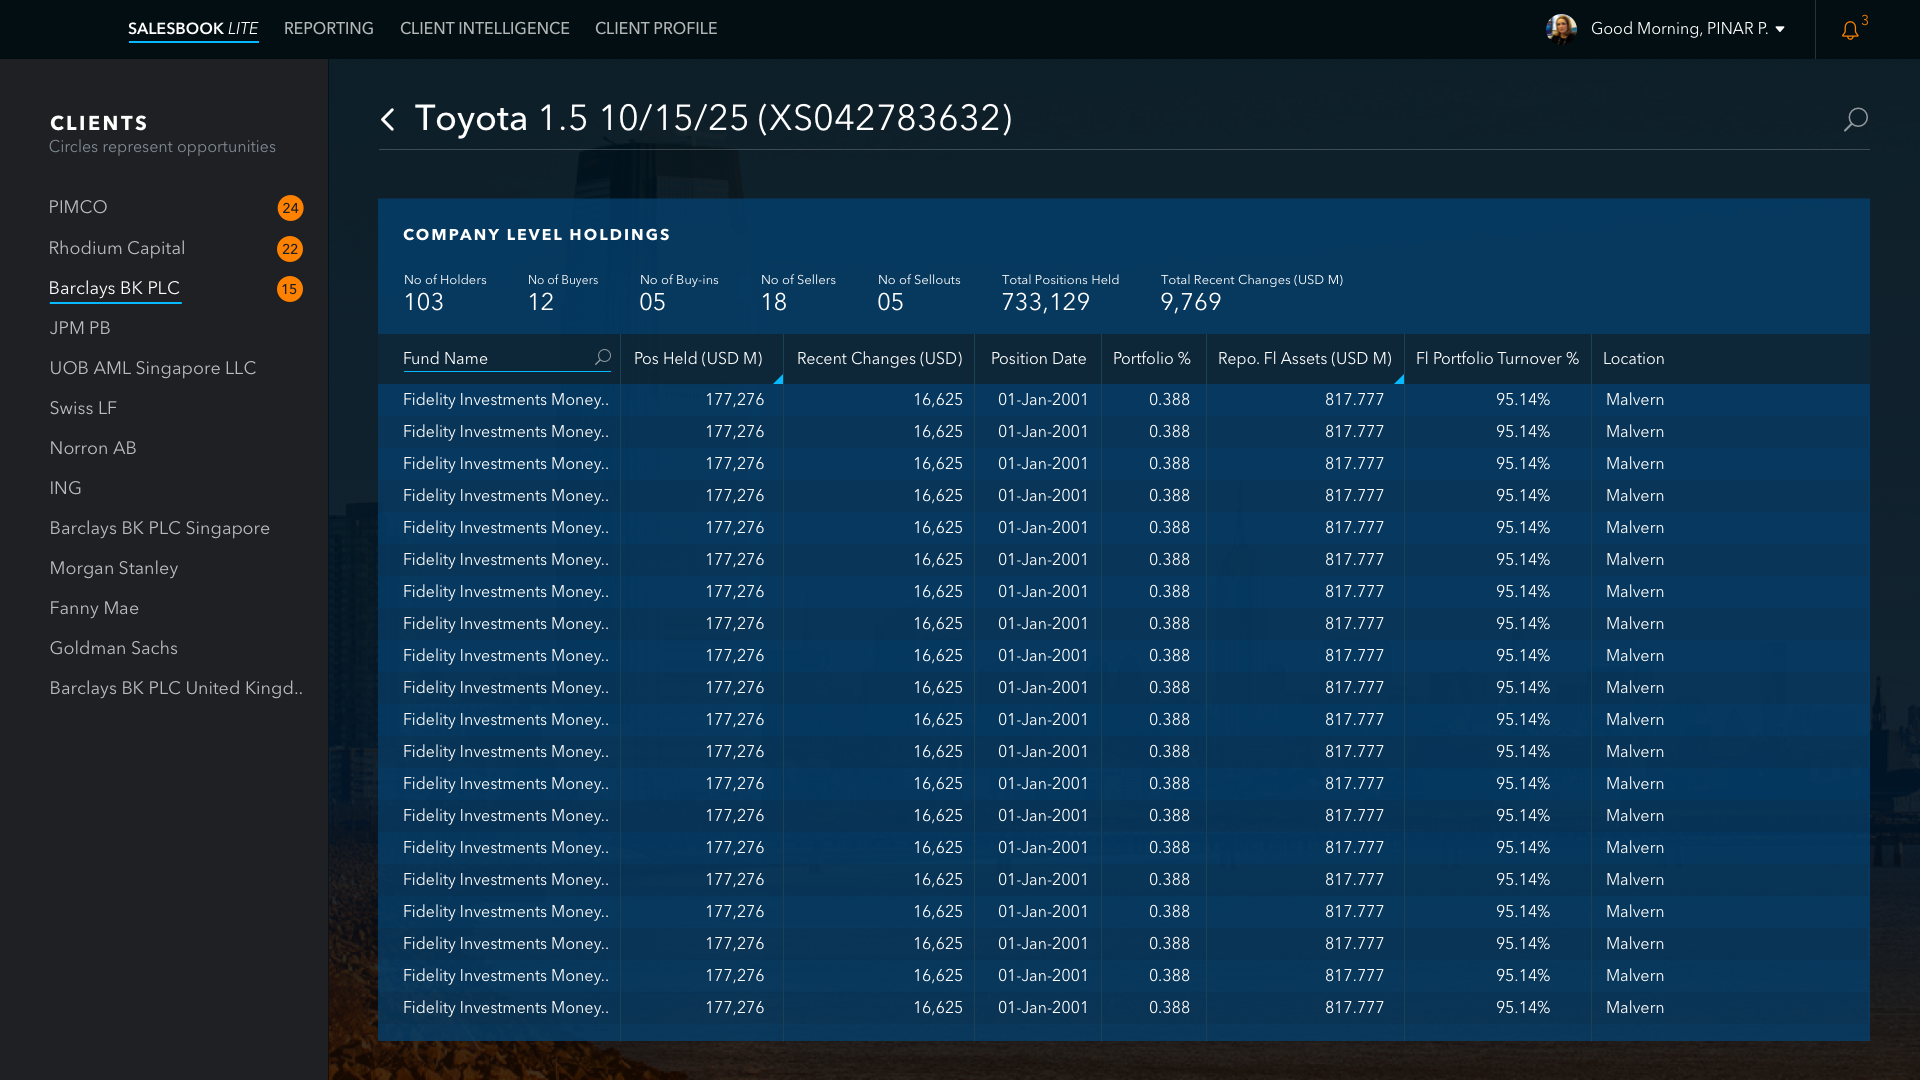
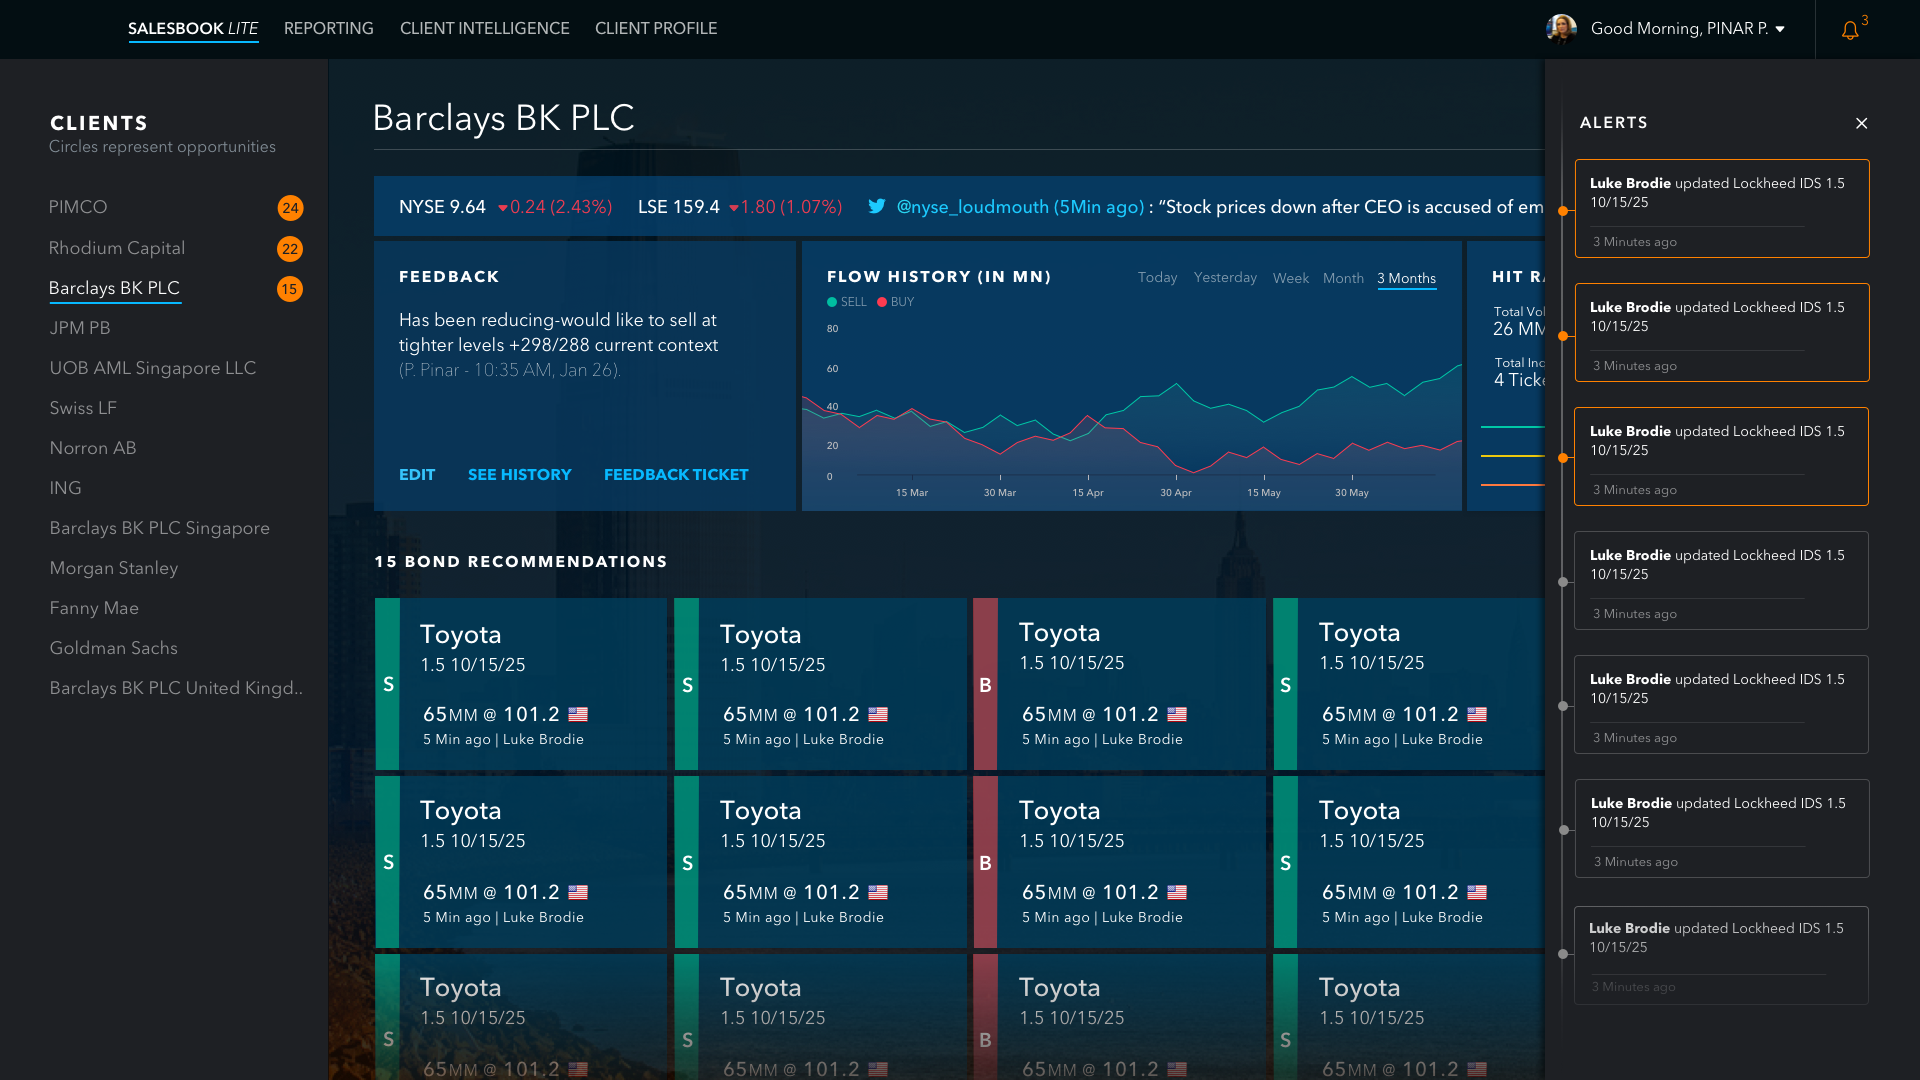
Below is the Axure prototype itself, captured as a 30-second walkthrough. The density is deliberate: a 24-client book across the top, an axe board of bond tiles, a full holdings table. Salespeople can't react honestly to placeholder data, so the prototype didn't have any.
Usability testing
We ran fast, five-minute sessions with salespeople on the trading floor. Two participants kept coming back across the engagement and shaped the prototype most directly. Below is what each of them said in their own words — and what shipped because they said it.
Eric
Senior salesperson, ~50 clients in book
"Would definitely like to see client activity indication, to know which client is going cold."
What they told me
- Appreciated the tile view, but the prototype hadn't handled the edge cases of a 50-client book.
- Concerned that spreads and pricing data weren't updated properly — wanted to see when each security was last refreshed.
- Asked for feedback to live at the axe level, not just the client level.
- When a search returned no match, expected to see similar securities surfaced as fallback.
What shipped because of it
Client activity decay built into the client tile (last-touch timestamp + cold-client signal), "last updated" stamps on every security row, and a "no match — try similar" fallback path in search.
Amber
Salesperson, mixed coverage
"Likes the bond recommendations and the provision to hover and get more information."
What they told me
- Valued the count of recommended axes shown next to each client name — it gave the book scannable density.
- Liked the hit-ratio graphs and executed-trade indicators on the bond detail screen.
- Found tile sizing and color semantics confusing — same dimension shouldn't carry two meanings.
- Wanted client-level trade volume and activity surfaced as a default, not a drill-down.
What shipped because of it
Hover tile expanded into a full secondary detail panel rather than a tooltip; tile sizing normalized to a single dimension; client cards led with volume + activity, not name + status.
Five reviewers, three designs, one call
In parallel with floor testing, I took the three prototype directions to a wider review inside RBC. Five reviewers, each reading the same designs through a different lens — and almost no agreement between them.
Trading-system veteran
Density advocate
"Looks like Yahoo Finance dashboard, very web 3.0 — not aligned with trading-system look & feel. Made for a tablet, low information density. Tiles take up a lot of space — are there alternatives?"
For G., credibility on the floor came from information density. The redesign read as a consumer product, not a trader tool.
Information-design lead
Synthesis
"Designs look like they're made for mobile. The challenge is how to apply it to a trader's desktop where information density is at a premium. Take the tiles from the first, apply it to the second, improve the colors."
C. named the actual structural answer — tile semantics from one direction, layout density from another — but the trade-offs underneath were still mine to weigh.
Salesbook product owner
Product fit
"Prefers the second design. Likes the coloring, prefers bond opportunities at the top, the styles, the symmetry. Good use of space given that we will be launching in Salesbook."
E. was anchored in how this would land inside the larger Salesbook product — symmetry and spatial reuse mattered more than novelty.
Sales floor representative
Tone & identity
"The second one looks futuristic, fancy — in a positive way. Likes the strawberry red with blue, likes seeing clients and updates at once."
A. was reading for tone. The product needed to feel distinct enough that salespeople would want to open it instead of falling back to the old screen.
Detail / semantics reviewer
Clarity
"Unclear what the red and blue circles refer to. All references to "Updates" should be renamed "Alerts". All graphs should make the time-period being displayed clear. Tiles in different sizes — confusing."
R. was reading at the micro level. Every visual element needed to carry an obvious semantic, especially on a screen this dense.
The surface read was that everyone disagreed. The real read was that the disagreement had only one axis: information density vs. modern clarity. G. and C. were both arguing for density because the screen lived next to a Bloomberg terminal on a trader's desktop. E., A., and R. were arguing for clarity because the previous screen had failed them on exactly that.
The trap was to treat this as a vote. The work was to recognize that the two camps weren't actually in conflict — they were describing different parts of the same problem. The screen had to be denser than a modern web app and clearer than the one it was replacing.
The call I made
- Keep the tile structure from the first direction — it gave each opportunity a discrete, scannable footprint. Override A.'s "fancy" preference where it pushed against scannability.
- Adopt the second direction's layout — bond opportunities anchored to the top, hit-ratio and flow-history together in the middle. This was the density gain G. and C. were asking for, without going back to an eight-panel wall.
- Take every semantic ambiguity R. flagged seriously. Rename "Updates" to "Alerts", give every chart an explicit time-period, kill the unlabeled red and blue circles, normalize tile sizing. None of this was glamorous; all of it was non-negotiable on a screen this dense.
- Deliberately set aside the "looks like Yahoo Finance" critique as a tone read, not a structural one. The product needed to feel like it belonged in 2016, not 2006 — A. and E. were right about that, and reverting to a Bloomberg pastiche would have undermined the workflow gains.
What shipped wasn't anyone's first choice. It was the version of the design where the real trade-offs had been made deliberately, in writing, with a logic the team could push back on. That made the visual direction defensible — not because it was consensus, but because the reasoning was visible.
Visual design
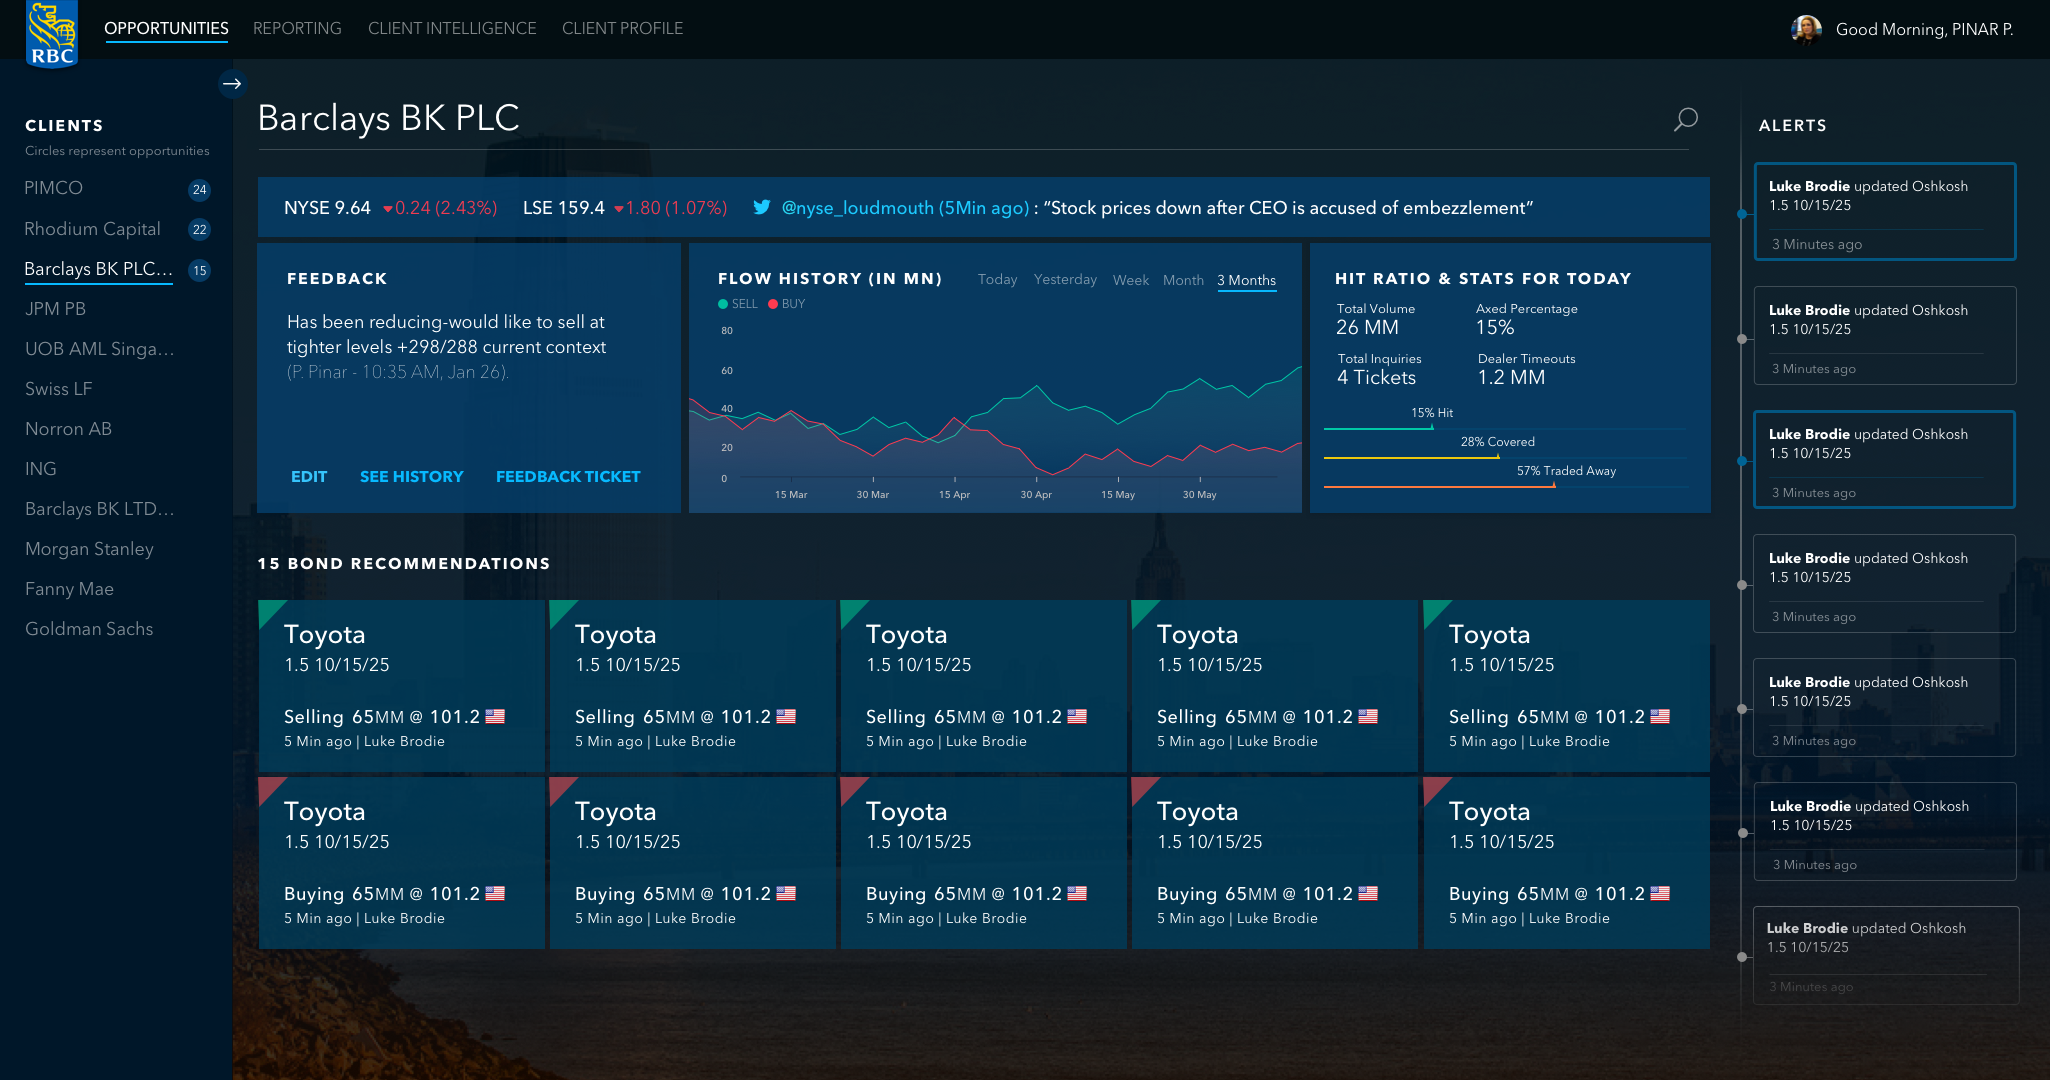
The final visual direction did exactly what the synthesis said it would. Tile as the unit of an axe, scannable at a glance. Density gained back through layout, not by reverting to an eight-panel wall. Semantics taken seriously — every chart with its time-period, every dimension carrying one meaning, "Updates" renamed "Alerts." Modern enough that a salesperson would want to open it; dense enough that it belonged on a trading desk.
v1.6 delivery · April 2016
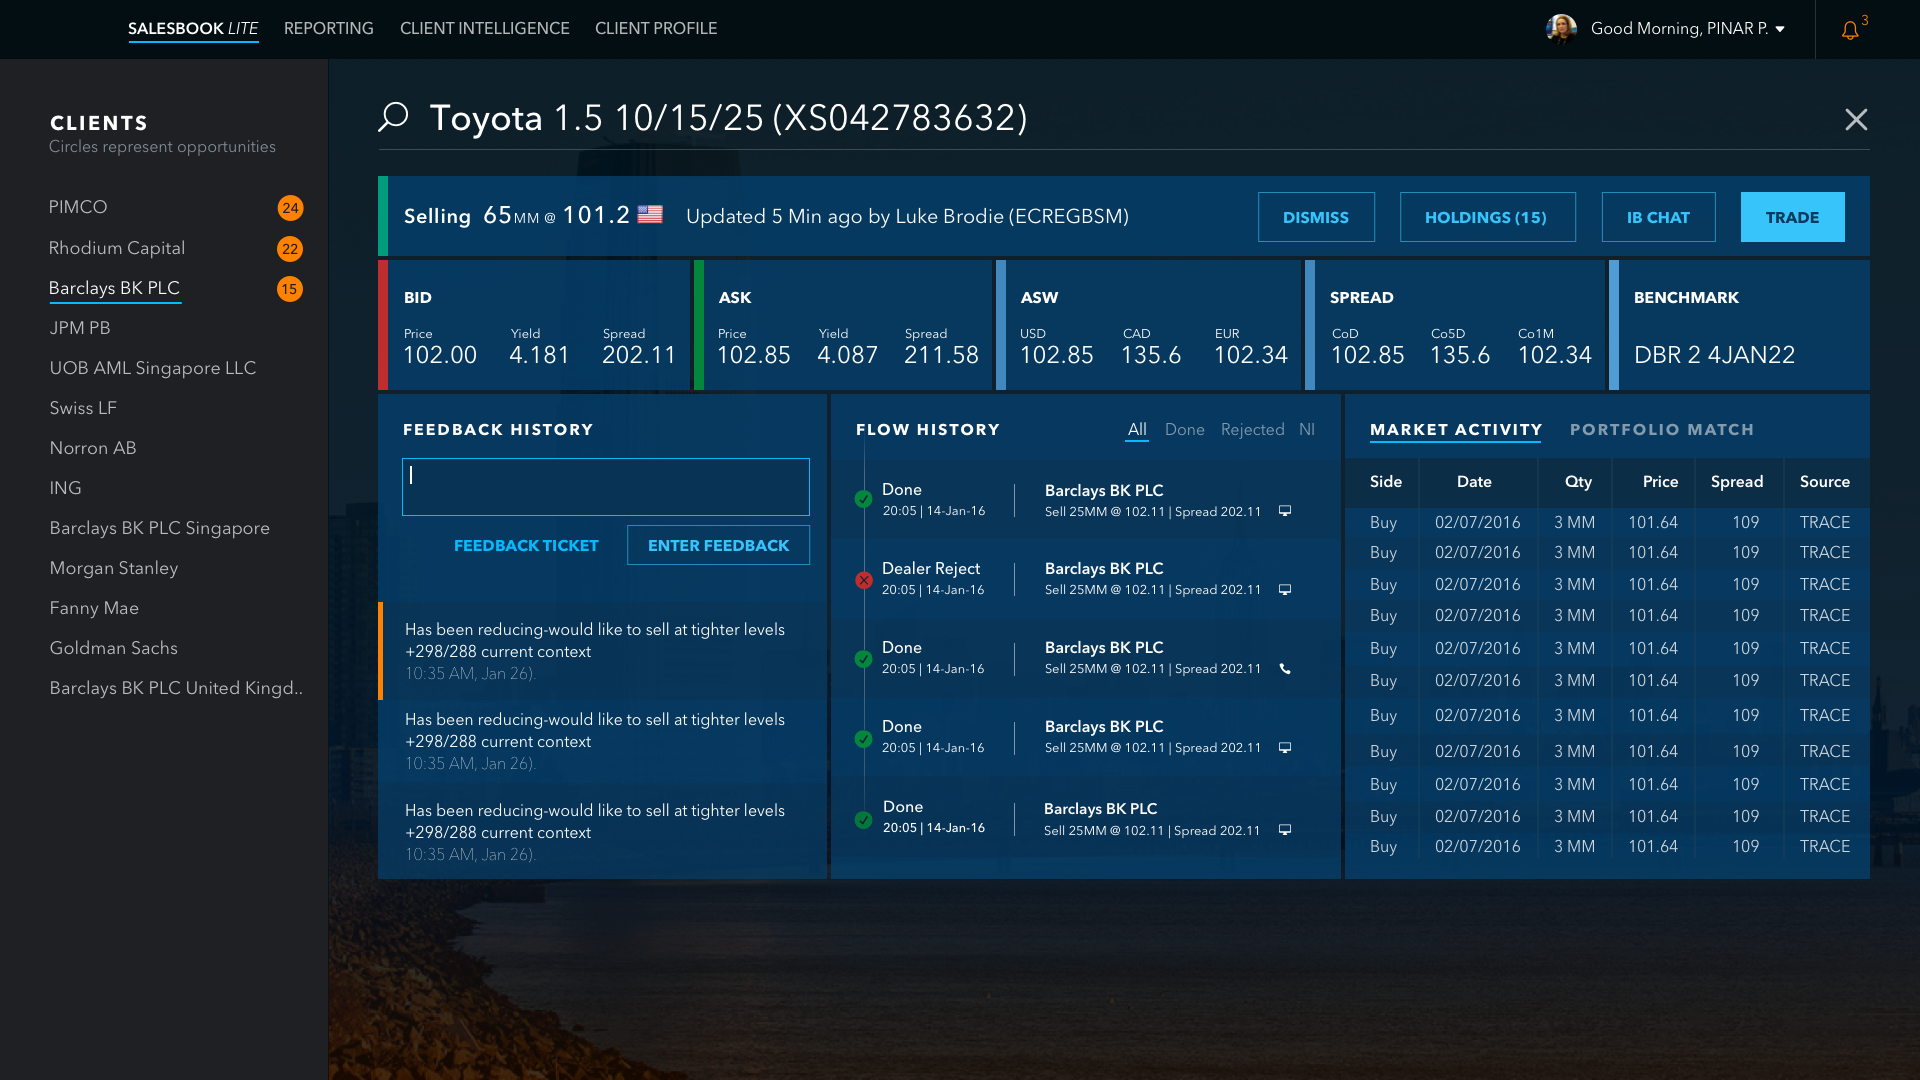
Interaction states
Hovering as the secondary surface
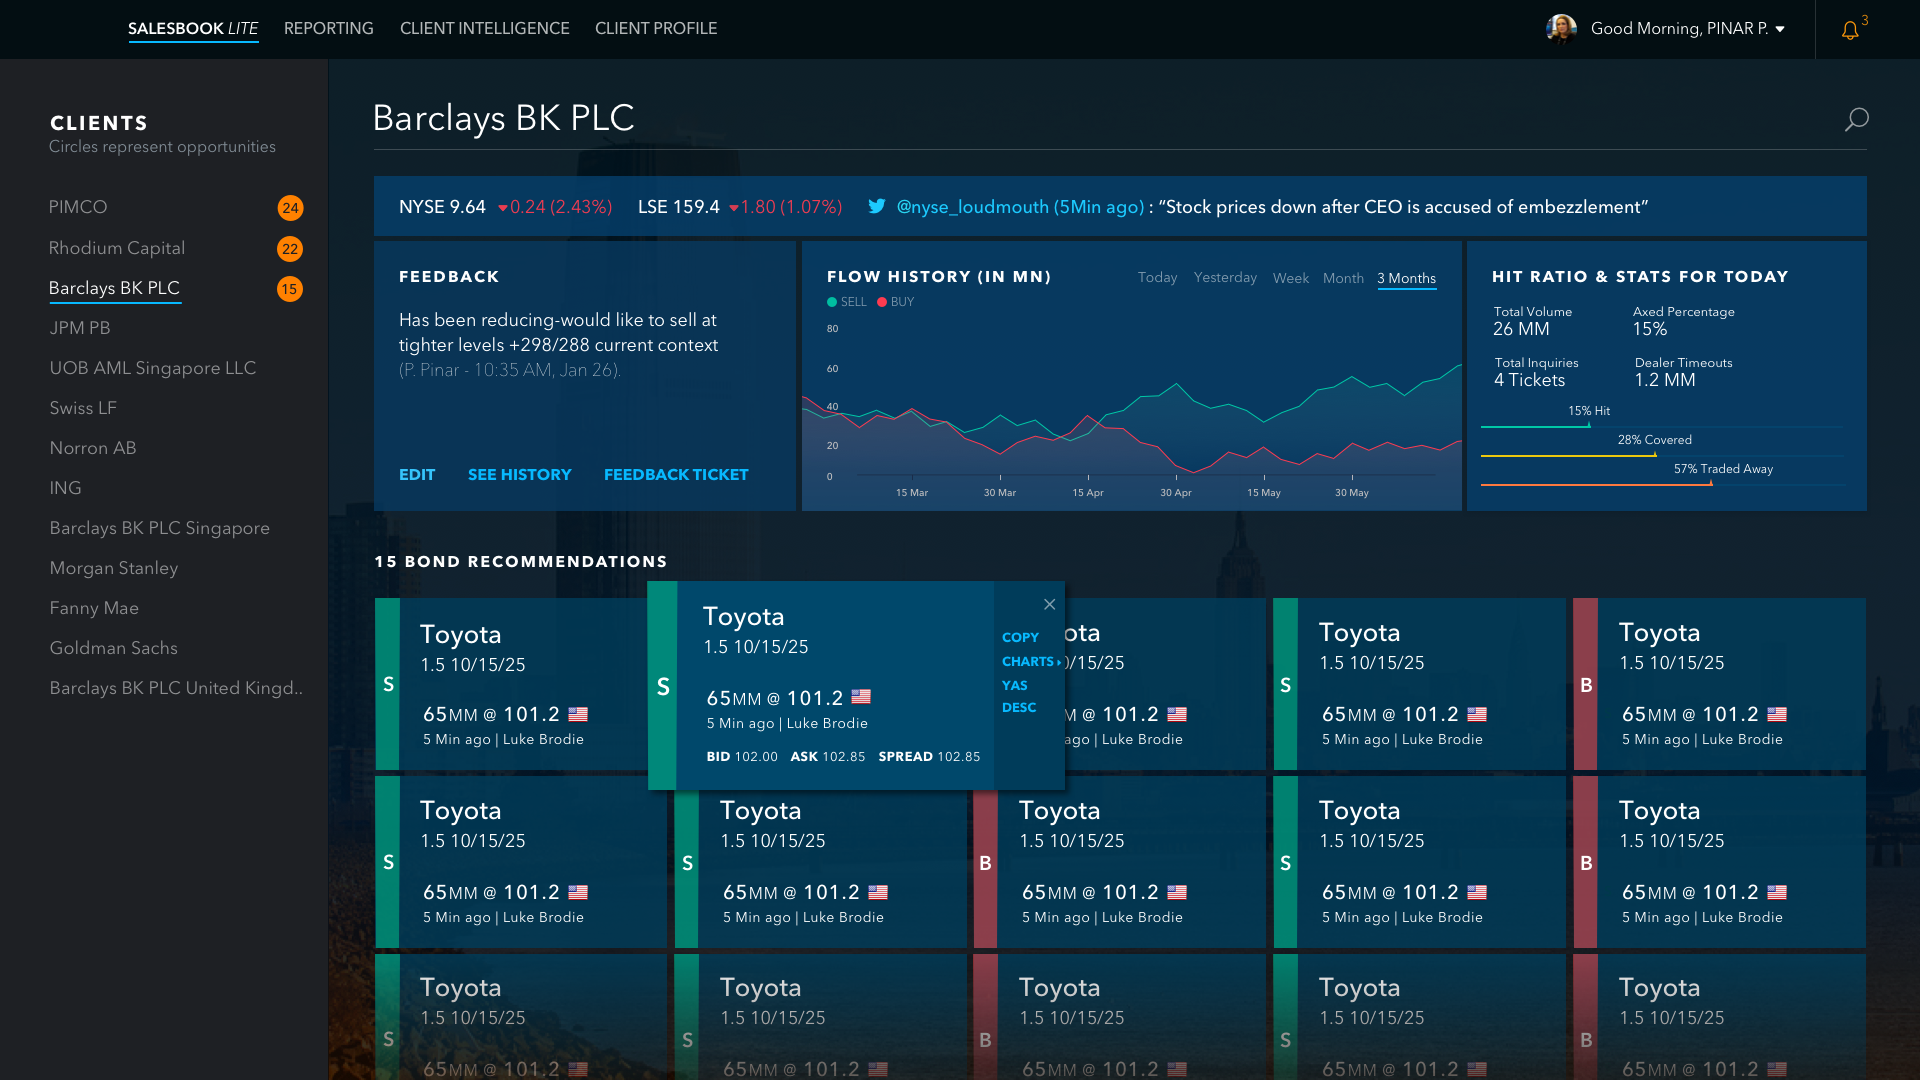
In testing, Amber pointed at a behaviour that hadn't yet been named:
"Likes the bond recommendations and the provision to hover and get more information."
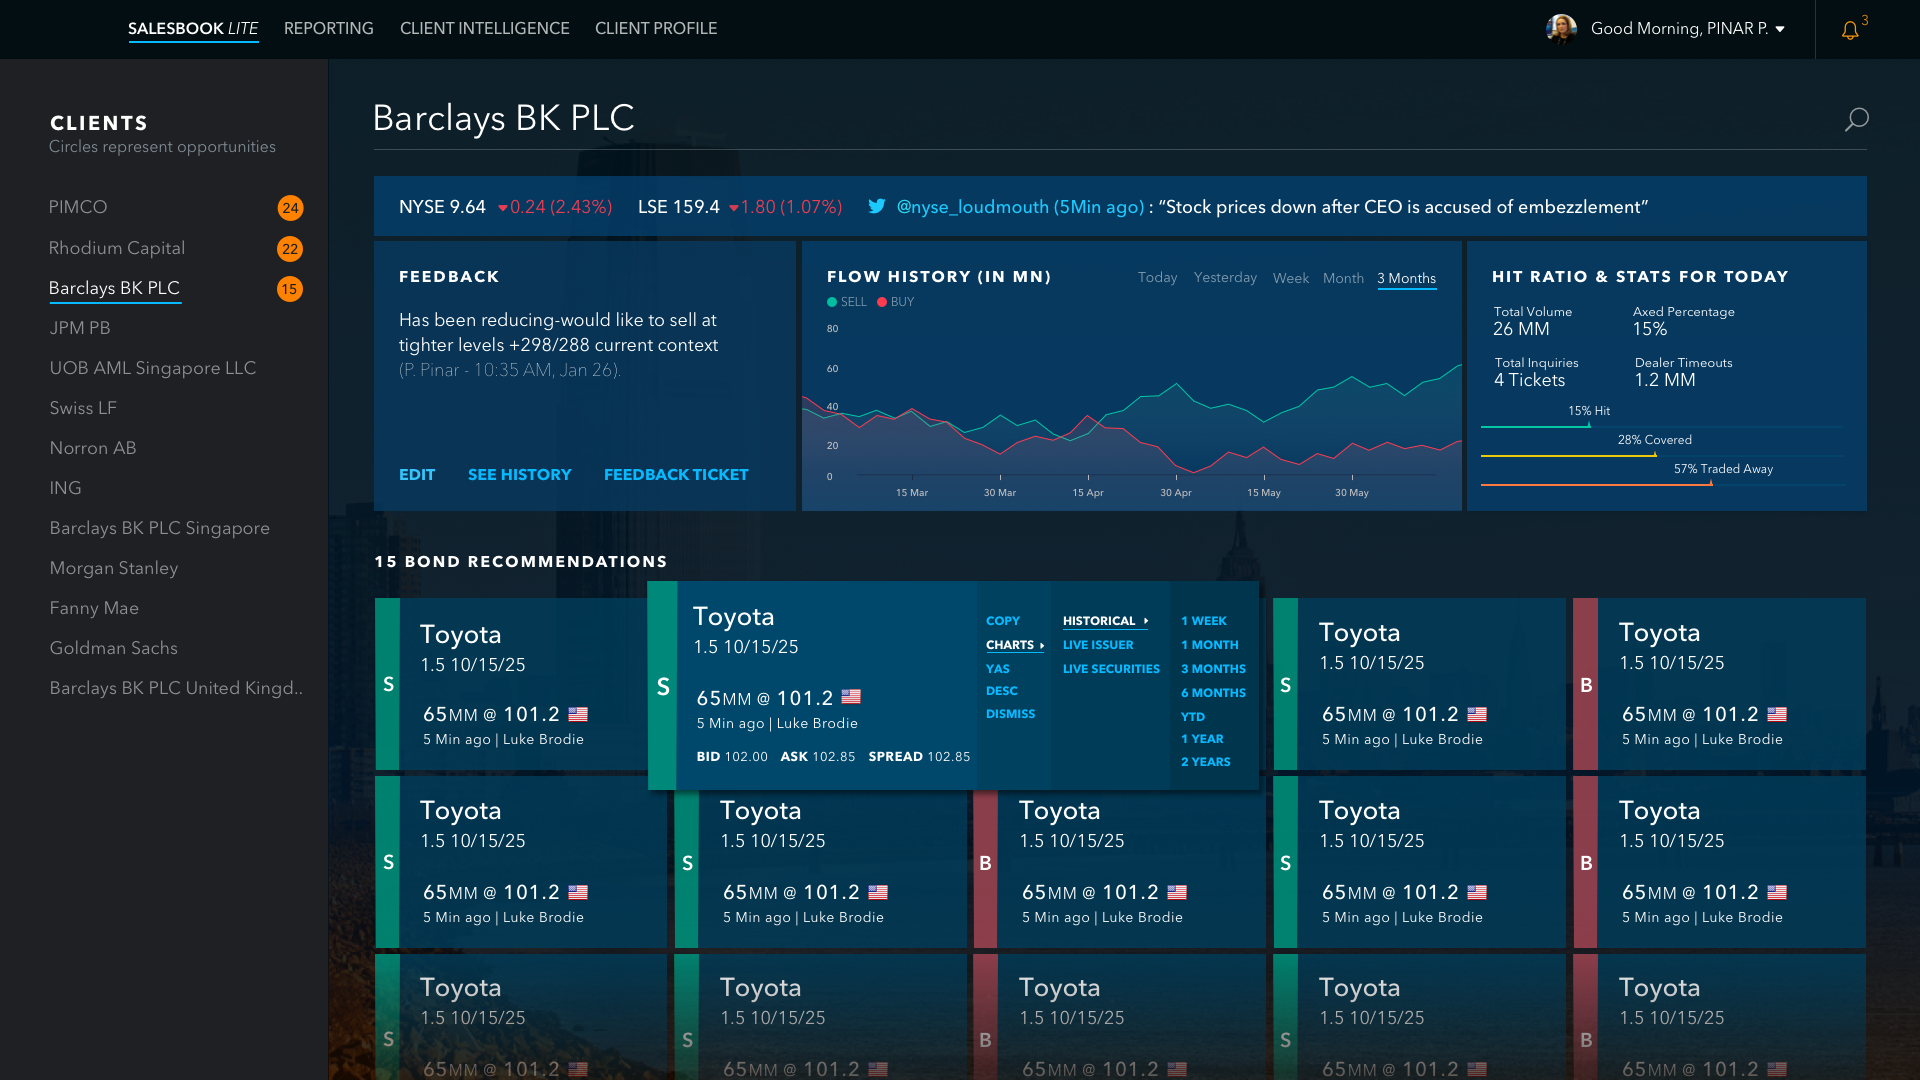
Hover was carrying real load. It was the salesperson's way of asking "tell me more about this one" without leaving the scan. The redesign treated hover as a deliberate secondary surface, not a tooltip — a small set of actions (shares, copy, charts, historical, live traders) that kept the user on the axe board while still letting them go deeper on a single tile.
Why it mattered
A trader's desktop punishes click depth. Every "open a panel to see more" costs attention. The hover pattern let salespeople peek without losing their place on the board — which is what kept the screen scannable even at 15 bonds.
Where it went
Consulting work usually ends at handoff, and you rarely see the long tail. I left this engagement at the v1.6 delivery in 2016. It resurfaced two years later, in RBC's own newsroom — not something I went looking for.
In March 2018, Kim Prado, the RBC executive who led the Salesbook program, was named Technology Innovator of the Year at the Women in Data and Technology Awards in London. The write-up credited Salesbook with streamlining "colleague access to client information which had hitherto existed in disparate locations," and her team with using "machine learning techniques to connect RBC inventory…with client data points to present attractive trading proposals to our sales teams."
That last line is the security-first workflow this case study is built around: securities in focus, ranked against client fit, surfaced as opportunities. To be precise about scope — I was the embedded UX lead on the Opportunities redesign inside a much larger program, not its owner, and the recognition is hers and her team's. But it's rare to get external, on-the-record confirmation that the model held up, shipped, and mattered enough to be named publicly. This is the closest thing I have to it.
RBC Capital Markets · Newsroom · March 2018
"RBC's women attribute recognition from the technology industry to ambition and a strong support network"
Salesbook named · Technology Innovator of the Year, Women in Data & Technology Awards
What carried forward
Model
Fix the workflow before the screen
The most useful early move on a "cluttered UI" project is to ask whether the workflow has one fixed entry path serving many real ones. If yes, the screen will fight you until the model gets fixed.
Decisions
Make the trade-offs visible in writing
Five reviewers disagreed on a vote and agreed on a structure. Naming the disagreement axis ("density vs. clarity") and writing down what got kept, overridden, and set aside turned a stalemate into a defensible direction.
Research
Five-minute tests are enough when the prototype is real
Realistic data density meant salespeople could react to the workflow rather than the abstraction. The shortest sessions of the engagement produced the most concrete product calls.
Honest constraint
The engagement was scoped at four months and ended with a validated prototype and a clearer product model — not long-term usage data. I'd take that constraint again to get this far, this fast; I'd also push for a measurement window the next time around.