TL;DR
Lucidchart's org chart feature had a longstanding UX debt problem: users had to double-click into a "Generator Mode" to edit anything. It was a walled garden that confused users, contradicted the rest of the canvas, and produced the most common complaint in org chart NPS data — "it's hard to use."
I led the UX for removing Generator Mode entirely, rearchitecting how users interact with org charts on the canvas — modeless, consistent, and discoverable. The change required designing new selection interactions, a dynamic context panel, backwards compatibility for every existing org chart in the product, and a staged release strategy. Post-release weekly interaction events grew 4–5× within the first two months.
4–5×
Increase in weekly interaction events post-release
628K
Peak weekly events (Aug 2023, up from ~140K pre-release)
30+
Users in structured usability sessions and in-depth interviews
3 yrs
Of analytics tracked post-release (2022–2025)
Context & Strategic Framing
Lucidchart's org chart feature was built on top of a "Generator" — a specialized shape group with its own interaction layer. When users wanted to edit an org chart, they double-clicked to enter Generator Mode (GM): a visually distinct state with its own panel, its own hotkeys, and its own canvas behavior. Double-click out to leave. It was, functionally, an app-within-an-app.
This made sense when it was built: the generator simplified complex tree operations. But over time, as the rest of the Lucidchart canvas matured, Generator Mode became an outlier. Users who knew how to use frames, timelines, and data-linked shapes were baffled by org charts behaving differently. First-time users hit the double-click barrier and bounced.
The initiative was framed internally as "Remove Generator Mode" (RGM) — but it was really a deeper question: what does it mean for an org chart to be a first-class citizen of the Lucidchart canvas? That framing mattered, because the answer wasn't just about removing a mode. It was about giving org charts the same interaction vocabulary as everything else on the canvas, while preserving the structured tree behavior that made them useful in the first place.
The Problem
The NPS data was unambiguous: the most frequent complaint for org charts was some variation of "hard to use." The internal hypothesis — shared by PM, design, and engineering — was that Generator Mode was the largest single contributor. Users encountered three recurring failure modes:
1. Mode confusion
Users didn't know they were in a different editing mode. They'd click outside the org chart while trying to add a node and suddenly find themselves unable to select anything. Or they'd enter Generator Mode accidentally and not know how to leave. The visual distinction between "inside GM" and "outside GM" was not obvious enough to interrupt the working mental model of "I'm just editing a diagram."
2. Interaction inconsistency
Inside Generator Mode: lasso to select, click to edit, specific hotkeys. Outside: click selects the whole chart, no node-level editing possible, different hotkeys. Users who had learned Lucidchart's canvas interactions had to maintain a parallel mental model just for org charts. Power users hit this wall when they tried to annotate an org chart with shapes, draw lines to nodes, or use conditional formatting — all of which required escaping Generator Mode first.
3. Discoverability failure
New users importing an org chart from data or dragging one from the shape library had no way to know they needed to double-click to edit it. There was no clear UI hint. The first experience of org charts was: "I made one, now I can't touch it." Prototype testing confirmed this — users stalled immediately on the first editing task without prompting.
"I honestly just kept clicking until I was able to edit."
"Right now it creates a mess if I don't double click a single block."
"How would I move this whole thing? What, do I have to highlight everything??"
"I found that when I try to resize the boxes I kept accidentally clicking the red plus sign — it caused me to give up midway."
"I couldn't figure out how to turn it off — I ended up finding a YouTube video."
"Org chart generator editor causes a ton of friction — users think org charts are broken."
Quotes from 30+ structured user interviews conducted 2022–2023.
My Role & Team
I was the lead UX designer for the RGM initiative, working alongside Chloe (PM), Di (design support), and an engineering team led by Gibson and Sean Holland. The project also involved close coordination with architecture review, the UFO/UC platform team, and HRBP stakeholders who were primary org chart power users.
What I owned:
- → Defining the new canvas interaction model for org charts — all selection states, editing flows, and context panel behavior
- → Leading prototype design and co-facilitating usability testing (12 users, Maze + moderated sessions)
- → Authoring the complete behavior specification for selection, copy/paste/duplicate, z-ordering, and UI hints
- → Steering the internal TUG (Trusted User Group) feedback sessions and synthesizing findings for engineering prioritization
- → Aligning the release and BCU strategy with PM and eng — determining what shipped in MVP vs. fast follow vs. future work
- → Establishing the analytics plan: defining which beacon events to replace "EnteredOrgChartEditMode" and how to measure modeless interaction success
Research & Discovery
The research program ran in parallel with the prototype spike, using a multi-method approach to pressure-test both the problem framing and the proposed solution simultaneously.
Usability testing & in-depth interviews (30+ users)
We ran moderated prototype sessions and in-depth interviews with 30+ org chart users, covering the core tasks most likely to surface mode confusion: creating an org chart, editing nodes, moving branches, adding annotations from outside the chart, and collapsing nodes. Sessions were structured around a "hello, thank you for feedback" framing to avoid priming users toward the mode change. We reserved the final 10 minutes of each session for open-ended suggestions and reactions.
Key finding: users consistently attempted classic canvas interactions first (click to select, drag to move) and were surprised when they didn't work. When given the prototype with Generator Mode removed, most completed editing tasks without prompting — validating that the new model was more learnable, not less powerful. Power users who had worked around Generator Mode entirely (using copy-paste and manually drawing lines) were the most visibly relieved.
Internal TUG (Trusted User Group)
We recruited a cross-functional group of internal Lucid power users — including HRBPs, Sales Engineers, Customer Training, and PMs — who represented the primary enterprise persona for org charts: people who built and maintained org charts regularly for real organizational data. TUG feedback ran as a persistent Slack channel (#org-chart-feedback), with structured prototype shares and async feedback requests.
Key finding: TUG users surfaced critical edge cases that moderated testing missed — particularly around copying org charts between documents, annotating with connected shapes, and the behavior of org charts inside frames. These directly informed the fast-follow priority list.
NPS data & analytics baseline
We reviewed NPS verbatim data alongside the existing analytics baseline. Pre-RGM, weekly interaction events (entering and exiting Generator Mode) tracked at roughly 90K–155K events/week across 14K–23K distinct users. This became our baseline against which to measure post-release impact.
A key design implication of the analytics review: the existing beacon event ("EnteredOrgChartEditMode") would become meaningless after release. Part of the design work was defining what new events would replace it — tracking modeless interactions like node editing, branch movement, and direct canvas manipulation — so that post-release measurement was meaningful.
Prototype spike (Maze)
Alongside the moderated sessions, we ran a Maze test to get quantitative signal on task completion rates for the new interaction model. The Maze was scoped to the highest-risk flows: first-time selection of an org chart, adding a direct report, and moving a branch. Results informed which UI hints were essential for MVP vs. which were nice-to-have for fast follow.
What users said when they saw the modeless prototype
"Oh, so you can move it? That's nice!"
"This makes more sense to me."
"I can move it and click just one block. Prior to this it creates a mess."
Design Challenges
Removing Generator Mode sounds simple. It wasn't. Every interaction in Generator Mode had to be reimagined for a modeless canvas, and the design constraints were unusually tight: the new behavior had to feel native to the rest of the canvas, while preserving the structural semantics that made org charts different from a pile of shapes.
1. Selection without a mode
The challenge
In Generator Mode, selection was mode-specific: clicking a node selected it for org-chart editing, not canvas editing. Users couldn't select a node and then resize it, because GM's selection state was different from the canvas's. We needed a single selection model that worked for both org chart operations and general canvas operations.
How we solved it
We unified selection with the Classic Lucidchart model: a single click selects the shape with canvas handles, and org-chart-specific affordances (add direct report, add peer) appear contextually on the selected node. No mode switch required — the affordances surface based on shape type, not editor state.
2. Context panel that knows where you are
The challenge
Generator Mode had its own right-side panel for org chart properties. Outside GM, users saw the general Lucidchart properties panel. Removing GM meant we had to surface org-chart-specific properties (role, department, reporting line style) inside the shared panel — without cluttering it for users working on other shape types in the same document.
How we solved it
The context panel was made shape-aware: selecting an org chart node surfaces an org-chart property section at the top of the panel. Selecting a regular shape hides it. This required coordinating with the platform team who owned panel architecture, and we designed the org-chart section as a pattern for future shape-type-specific properties.
3. Z-indexing and layer order
The challenge
Org chart nodes have implied hierarchy — a manager always visually "owns" their direct reports. In Generator Mode, this was enforced by the mode itself. On the open canvas, users could freely reorder layers, which could break the visual hierarchy that makes an org chart readable (e.g., a direct report appearing to float above its manager line).
How we solved it
We preserved org chart hierarchical z-order as a constraint on the data model, not the editor state. Nodes within an org chart group maintain their relative order regardless of canvas-level operations. Users can still move org chart groups relative to other canvas objects, but within the group, hierarchy is maintained automatically.
4. Backwards compatibility
The challenge
There were hundreds of thousands of existing org charts built in Generator Mode. We couldn't break them. Every document that loaded needed to continue working — existing connections, node styles, and data bindings had to survive the transition to the new model, even though the underlying editor state machine was changing.
How we solved it
Engineering handled the data migration at the document model level: existing GM documents were translated to the new shape format on load. My design responsibility was to ensure the new interaction affordances were consistent enough that existing users landing in an old org chart wouldn't be disoriented — confirmed through prototype testing with long-term org chart users.
5. Copy, paste, and duplicate behavior
The challenge
In Generator Mode, copying a node copied it within the org chart's hierarchical context. On the canvas, copy/paste is flat — you get the shape, not its hierarchical relationship. We needed to decide: does pasting an org chart node paste it as a standalone shape, or as a connected node in the hierarchy?
How we solved it
We designed two distinct behaviors based on target: pasting within the same org chart group preserves the hierarchical relationship (node pastes as a peer to the original). Pasting outside the org chart group, or to a new document, pastes the shape standalone. This matched user mental models from research — most users who copy-pasted expected context-aware behavior.
Key Design Decisions
Adopt Classic Lucidchart interactions as the north star, not a hybrid
Early in the project, there was a temptation to meet Generator Mode halfway — keep some of its unique interactions and add canvas-native ones on top. I pushed back on this. A hybrid model would have preserved the underlying inconsistency: users would still need to know "which mode am I in." The clean decision was to treat Classic Lucidchart canvas interactions as the source of truth and rebuild org chart interactions to match them, even where that meant rebuilding more infrastructure. That clarity made every subsequent design decision easier.
UI hints over onboarding modals
One early proposal was to add an onboarding modal or tooltip sequence to explain the new interactions to existing users. We rejected this in the MVP. The logic: if we needed a modal to explain interactions, the interactions weren't good enough. Instead, I invested the design effort in UI hints — hover states with blue borders, cursor changes on approach to org chart nodes, (+) icons for adding direct reports — that communicated the interaction model without a tutorial. Onboarding support was scoped to a fast-follow sprint for edge cases, not as a crutch for first principles.
"Do No Harm" test strategy over a big-bang release
Given the scope of the change — every org chart in the product, every user's workflow — we designed the release as a 50:50 A/B test on new users first. Existing users were explicitly out of scope for the initial release. The test hypothesis: new users on the modeless experience would complete their first org chart task at equal or higher rates than new users on Generator Mode. This let us validate the new model on a clean cohort before migrating anyone's existing work. BCU (backwards compatibility update) for existing users followed in a separate sprint once the A/B test confirmed no regressions.
Scope discipline: what we deliberately didn't build
RGM generated a long list of improvements users and stakeholders wanted: revision history for generators, org chart data management overhaul, new onboarding flows, conditional formatting redesign, Assistant Shapes, better template integration. All of these were real and valuable. We explicitly deprioritized all of them for the initial release, treating them as separate initiatives. The mantra was "keep it simple where possible" — the goal was to remove friction, not add features. This required active product and design alignment across multiple steering meetings to hold the line.
Release Strategy
The release was staged across three milestones, each gated on the previous one passing validation:
Swarm test — June 27
Internal swarm with the engineering team and a small group of internal org chart users. Goal: smoke test the prototype in conditions approaching production. Surfaced a set of canvas interaction bugs (drag-and-drop not working when a generator was selected, z-ordering failures, paste location issues) that were resolved before moving to the A/B test.
RGM release — July 7
50:50 A/B test on new users only. Existing users continued to see Generator Mode. Analytics tracking switched from "EnteredOrgChartEditMode" to new modeless interaction events. The test ran for approximately two weeks before BCU was confirmed safe to proceed.
BCU + fast follows — July 21
Backwards compatibility update migrated all existing org charts to the new modeless model. Fast-follow sprint addressed the highest-priority polish items from the swarm and TUG feedback: UI hint refinements, onboarding support edge cases, line styling improvements, and additional selection state polish.
On the analytics plan
One of the less-visible but strategically important pieces of design work was defining the new beacon event schema before release. "EnteredOrgChartEditMode" would flatline to zero post-RGM — which would look like a catastrophic drop in engagement to anyone not tracking the project. We worked with the analytics team to define replacement events ("interactedWithOrgChart") that tracked modeless interactions and provided continuity in the measurement story. This made the post-release 4–5× increase readable as growth, not noise.
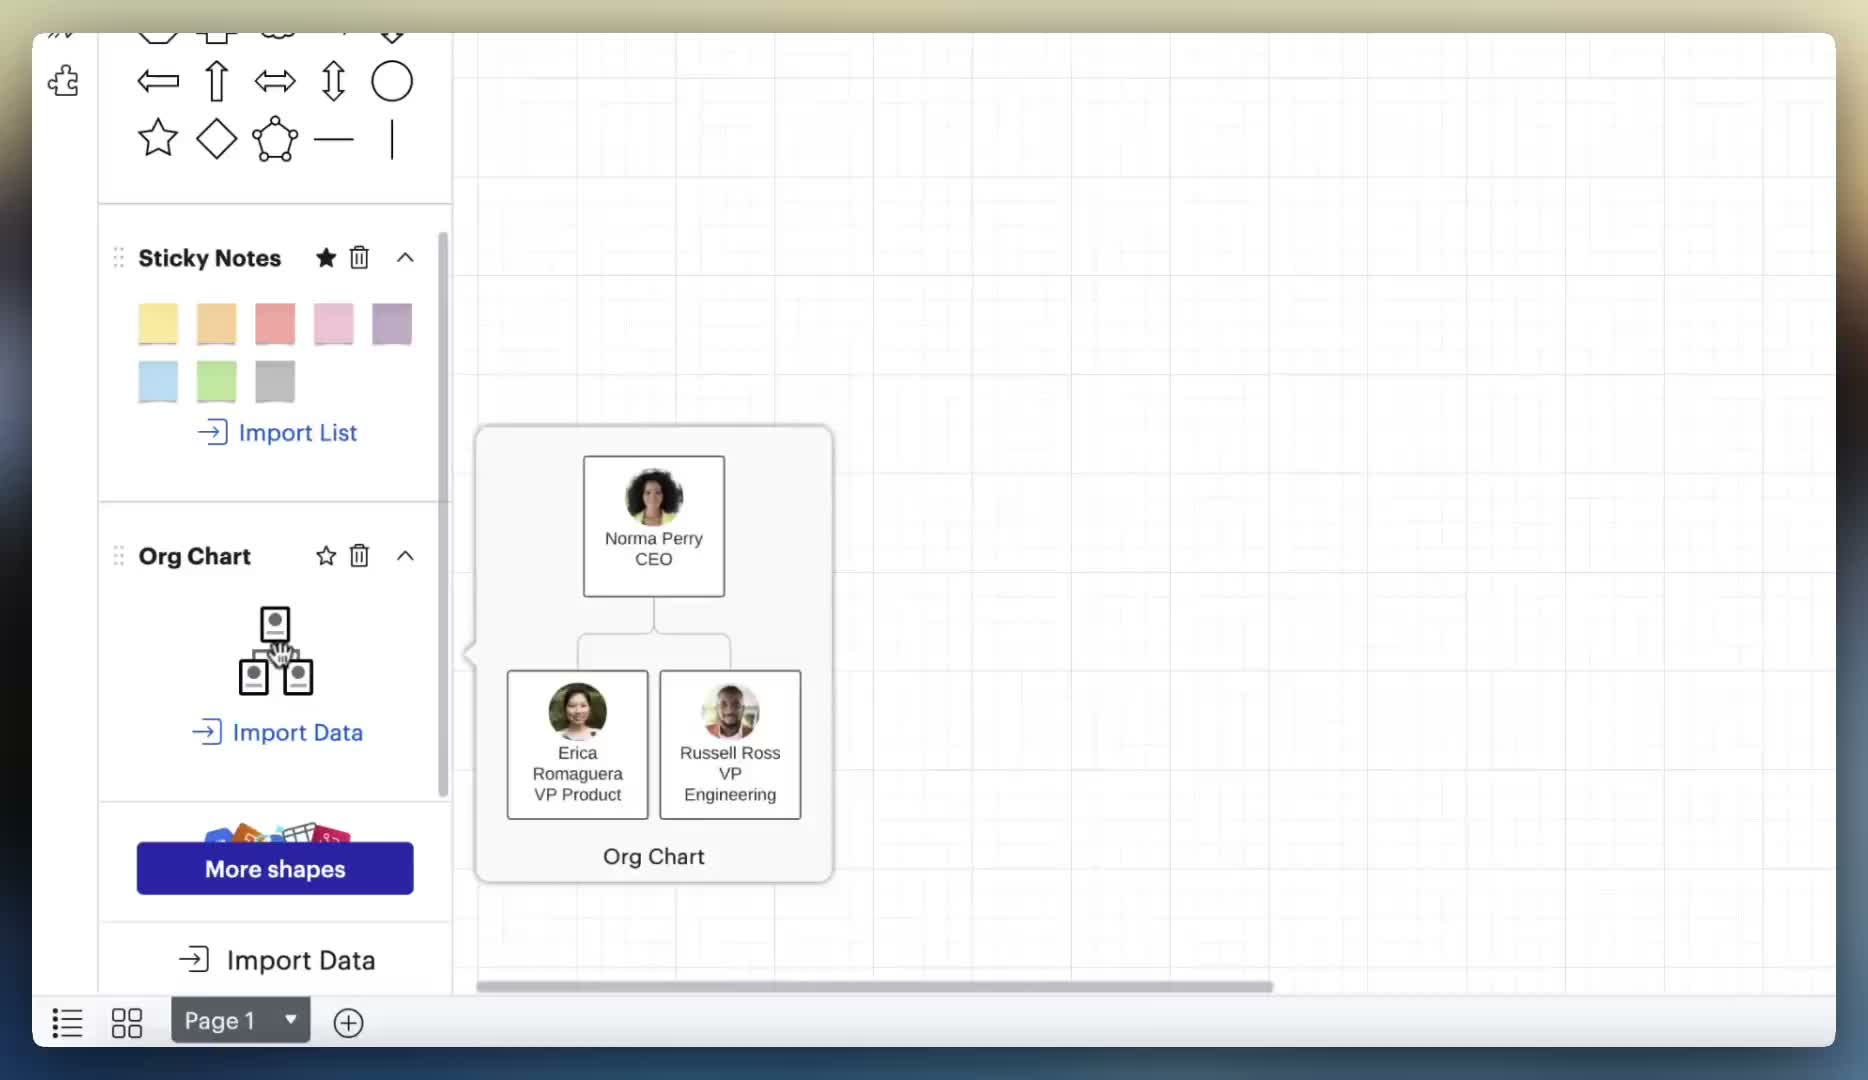
In Action
Prototype interactions showing the new modeless org chart canvas — node selection, branch manipulation, and on-canvas editing without entering a separate mode.
Modeless selection & editing
Click to select individual nodes, lasso for multi-select, click the chart border to grab the whole structure — no mode-switching required.
Branch manipulation & UI hints
Drag any node to move it and its subtree. UI hints show where the branch will land. No double-click required to begin.
Impact
The most concrete signal was in the analytics. Pre-release, weekly org chart interaction events ran at approximately 90,000–155,000 per week across roughly 14,000–23,000 distinct users. Post-release, those numbers stepped up dramatically:
Weekly interaction events (org chart)
| Period | Weekly events | Distinct users/week |
|---|---|---|
| Pre-release avg (2022 – June 2023) | ~130,000 | ~19,000 |
| July 2023 (release month) | ~157,000 → 240,000 | ~18,000 → 19,500 |
| Aug 14, 2023 (first full week post-BCU) | 582,878 | 20,431 |
| Peak (Aug 21, 2023) | 628,922 | 21,392 |
| Sustained (2024 avg) | ~570,000 | ~24,000 |
| Recent (2025 avg) | ~640,000 | ~27,000 |
The 4–5× step change in events and the continued growth in distinct users through 2024–2025 suggest that the modeless model didn't just remove friction for existing users — it made org charts accessible to a broader audience that previously bounced at the Generator Mode barrier.
The "Do No Harm" A/B test passed cleanly: new users on the modeless experience showed equal or better task completion rates with no significant regression in any tracked metric. The BCU proceeded on schedule.
Related shipped work
Org Chart Library Auto-Add
For users who indicated during signup that they wanted to create org charts, the org chart shape library was added to their workspace automatically — removing a discovery step that had been blocking activation.
+2.91%
Lift in engagement
+11.65%
Increase in Intelligent Diagramming usage
Reflection
The hardest part of this project wasn't the interaction design. It was maintaining scope. RGM created a gravitational field for every unresolved org chart problem — and there were many. Every steering meeting surfaced a legitimate ask: what about revision history? what about Assistant Shapes? what about the information architecture of the context panel? All of them were real. Saying "not in this release" required active design and product judgment, not just prioritization mechanics. The work that didn't ship in MVP enabled the work that did ship to be meaningfully better.
I also underestimated how much of the design work was actually decision documentation. For every interaction we designed, we needed an explicit specification of what happens in the edge cases: What if the user selects the org chart and a non-org chart shape simultaneously? What if they paste a node from a chart into a blank canvas? What if they try to copy a whole chart into a frame? These weren't glamorous design decisions, but getting them wrong would have produced bugs that felt like design failures. Investing early in complete behavior specs paid back in reduced back-and-forth with engineering.
One finding I didn't fully anticipate: how many power users had abandoned the intended interaction model entirely. Multiple participants — independently — had stopped using the red plus button to add nodes and switched to copy-paste only. One user had built a "bullpen" of people reporting to a fake supervisor as a reorg staging area. Another drew his own lines instead of using the generator. These workarounds were invisible in quantitative data, but they were a signal: Generator Mode wasn't just confusing to new users; it was insufficiently flexible for power users too. Removing it served both cohorts.
The interviews also surfaced something I hadn't seen in the data: org charts carry organizational and emotional weight that most diagramming tools don't. One participant manually reordered people in the chart before Tuesday presentations to avoid hurt feelings about where someone appeared in the hierarchy. The data model has no concept of "display order" vs. "reporting order" — which is why he never connected his chart to live data. It's a reminder that the human context of a diagram shapes how users interact with it in ways that interaction design alone can't fully resolve.
The biggest strategic lesson: removing something is harder to get approved than adding something. "Remove Generator Mode" sounded like a regression to stakeholders who hadn't felt the user confusion firsthand. The research — particularly the NPS data and usability sessions — was essential for building conviction across the organization. Data didn't just validate the decision; it gave everyone a shared vocabulary for why the change was necessary.
Finally: the analytics plan. Defining new beacon events before release — so that post-release success was readable — was the kind of work that doesn't show up in a design system or a prototype. It was invisible until it wasn't. When the 4–5× lift appeared in the data, it was legible because we had built the measurement infrastructure to capture it. That's a design decision too.